Zero gamma and the gamma flip
What zero gamma is, how it's found from the gamma profile, why another tool's gamma flip can sit somewhere else, and how traders read price crossing it.
The 30-second read
Zero gamma is the price where total dealer gamma would change sign: above it, dealers' hedging tends to damp moves; below it, to stretch them. Crossing it changes how the market may move, not which way. Many tools call it the gamma flip, though some compute it differently.
Found from the gamma profile
Total gamma exposure at today's price gives one number. To find where it would change sign, Theta Vantage recomputes it as if the price were elsewhere: 201 prices from 10% below spot to 10% above, holding implied volatility, time, and open interest where they are. That curve is the gamma profile, and zero gamma is where it crosses zero.
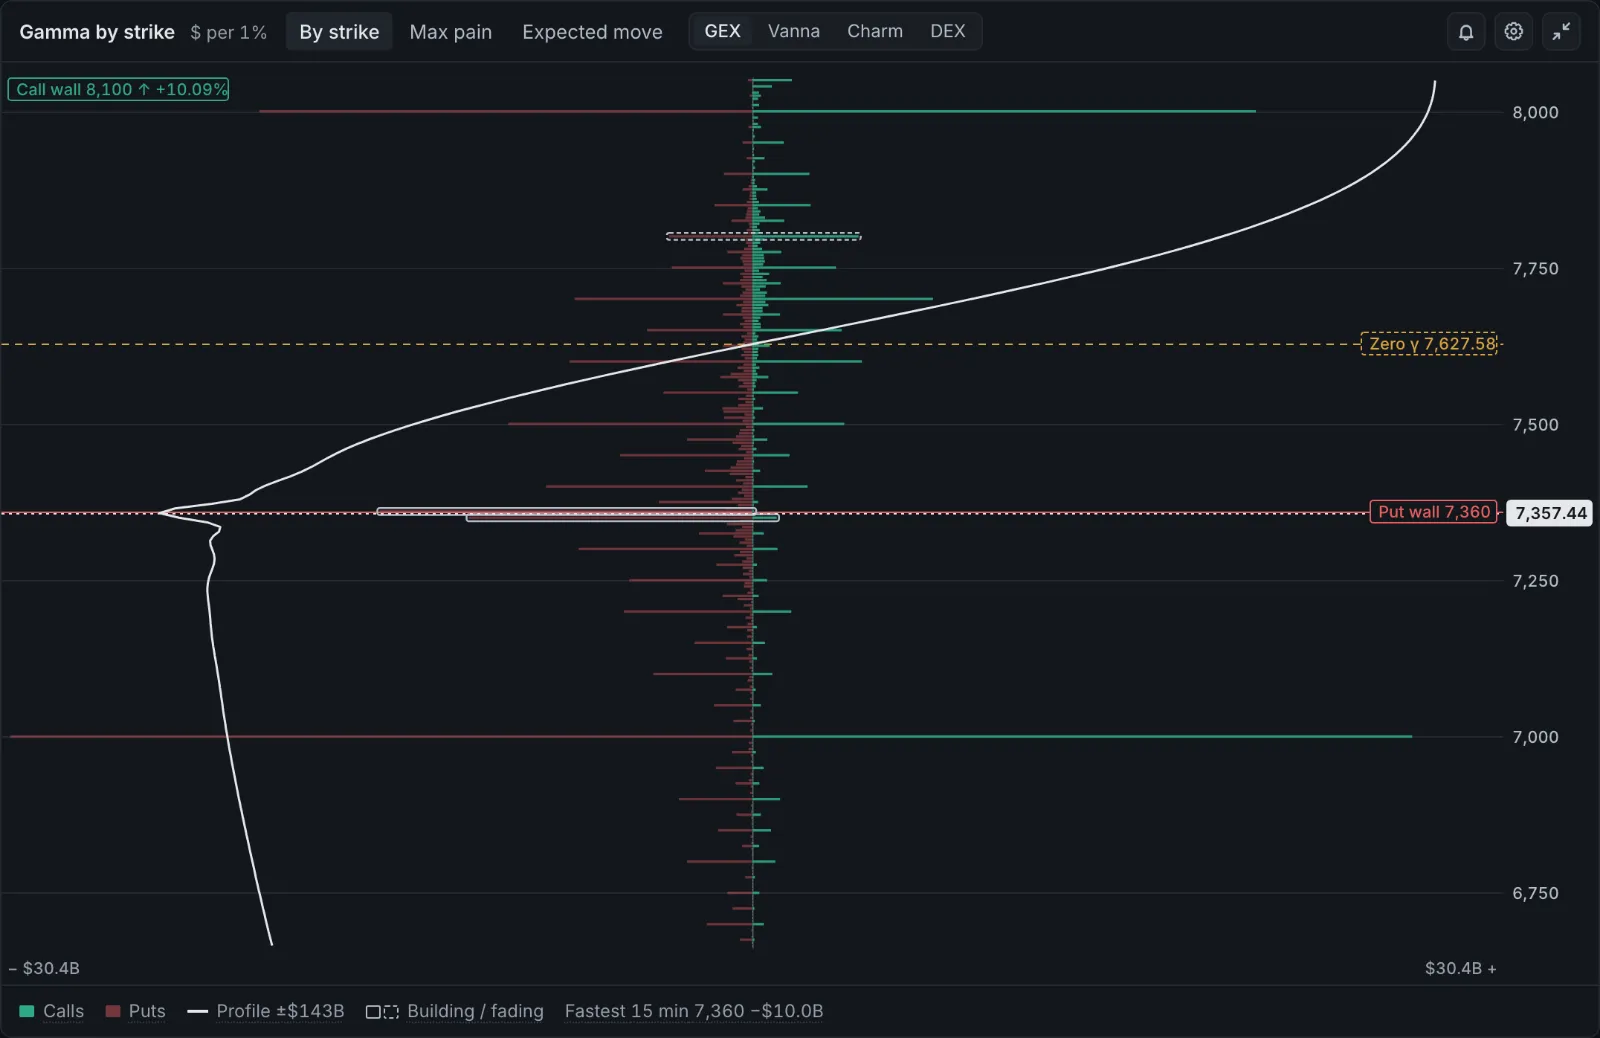
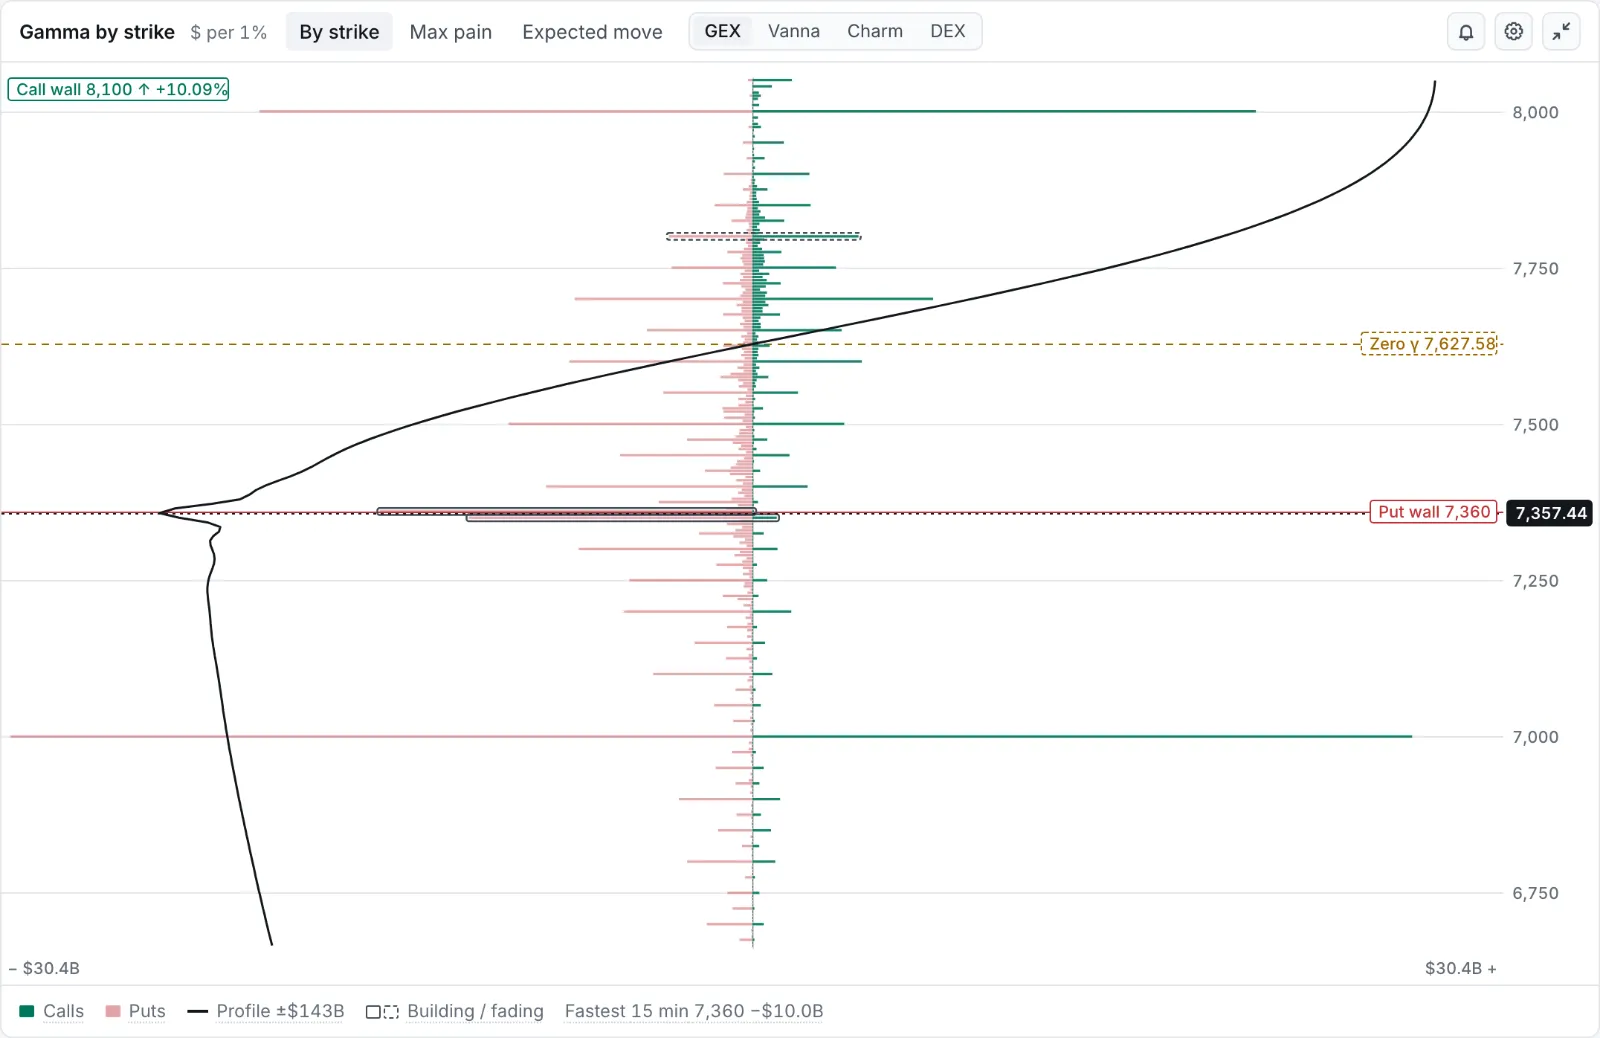
If the curve crosses more than once, the crossing nearest spot is the one shown. If it doesn't cross in range, the search widens once; with no crossing at all, the whole range sits in one regime and there is no zero gamma.
Not every gamma flip is the same
A common shortcut adds up GEX strike by strike at today's price and takes the strike where the running total crosses zero. It doesn't recompute gamma at other prices, so its "flip" can land somewhere quite different from the profile's crossing. When two tools disagree on the level, this is often why.
A crossing in numbers
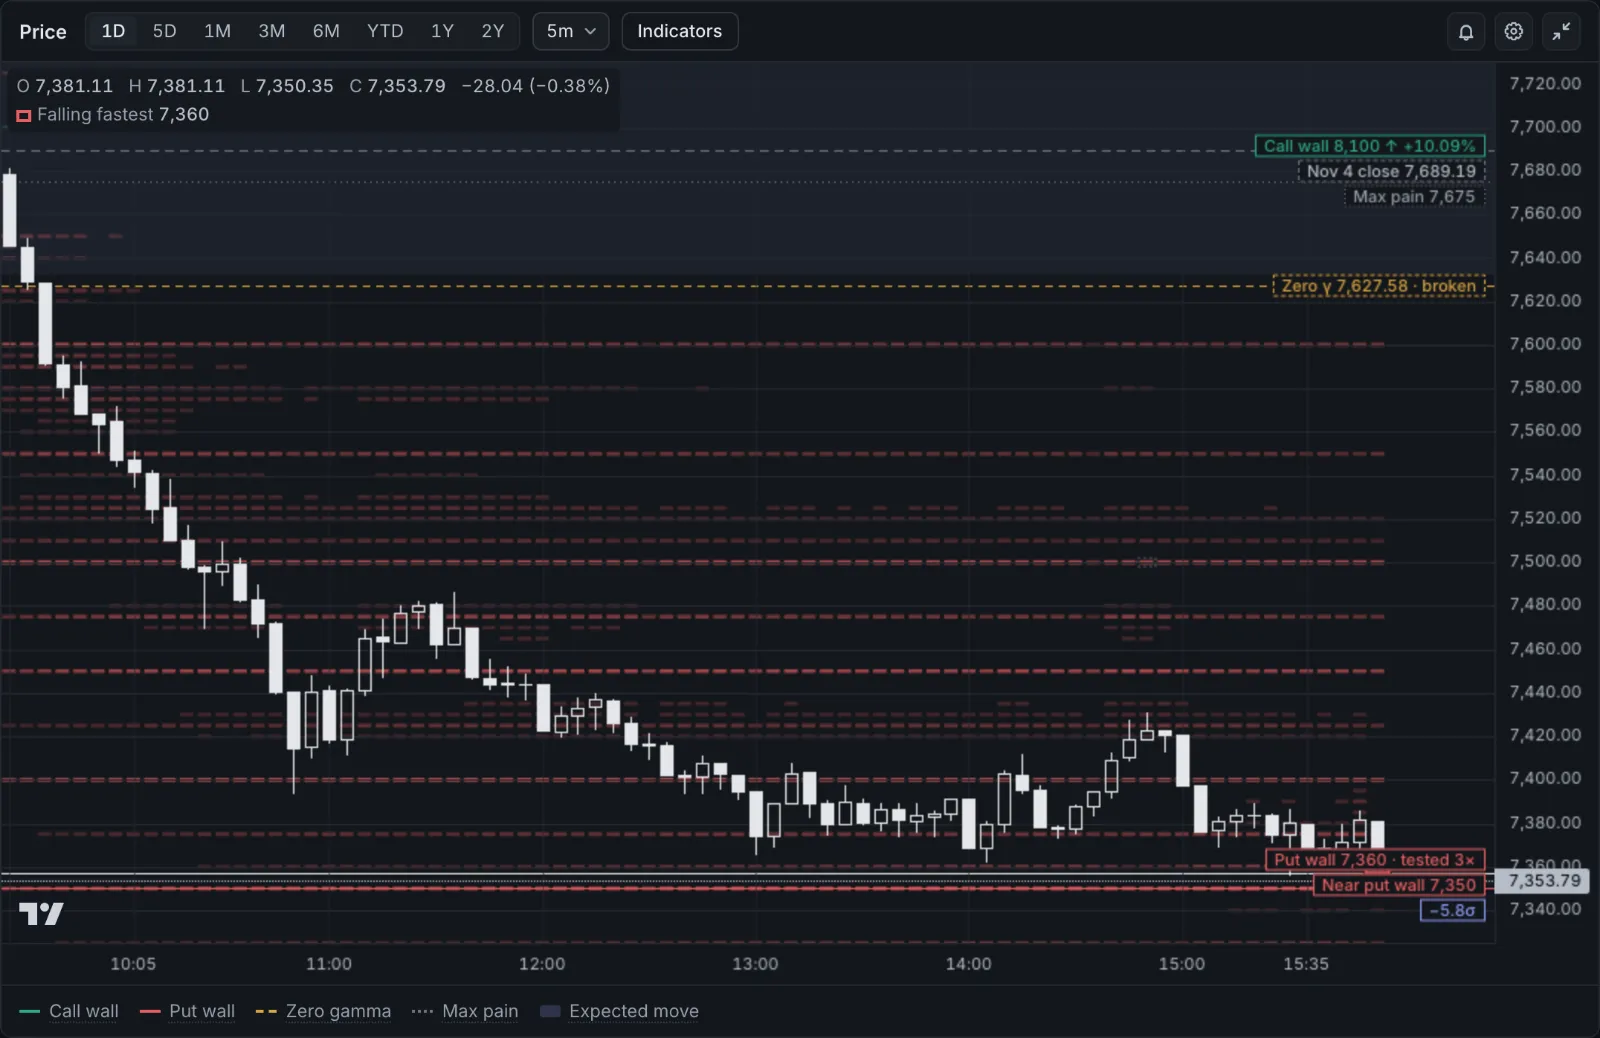
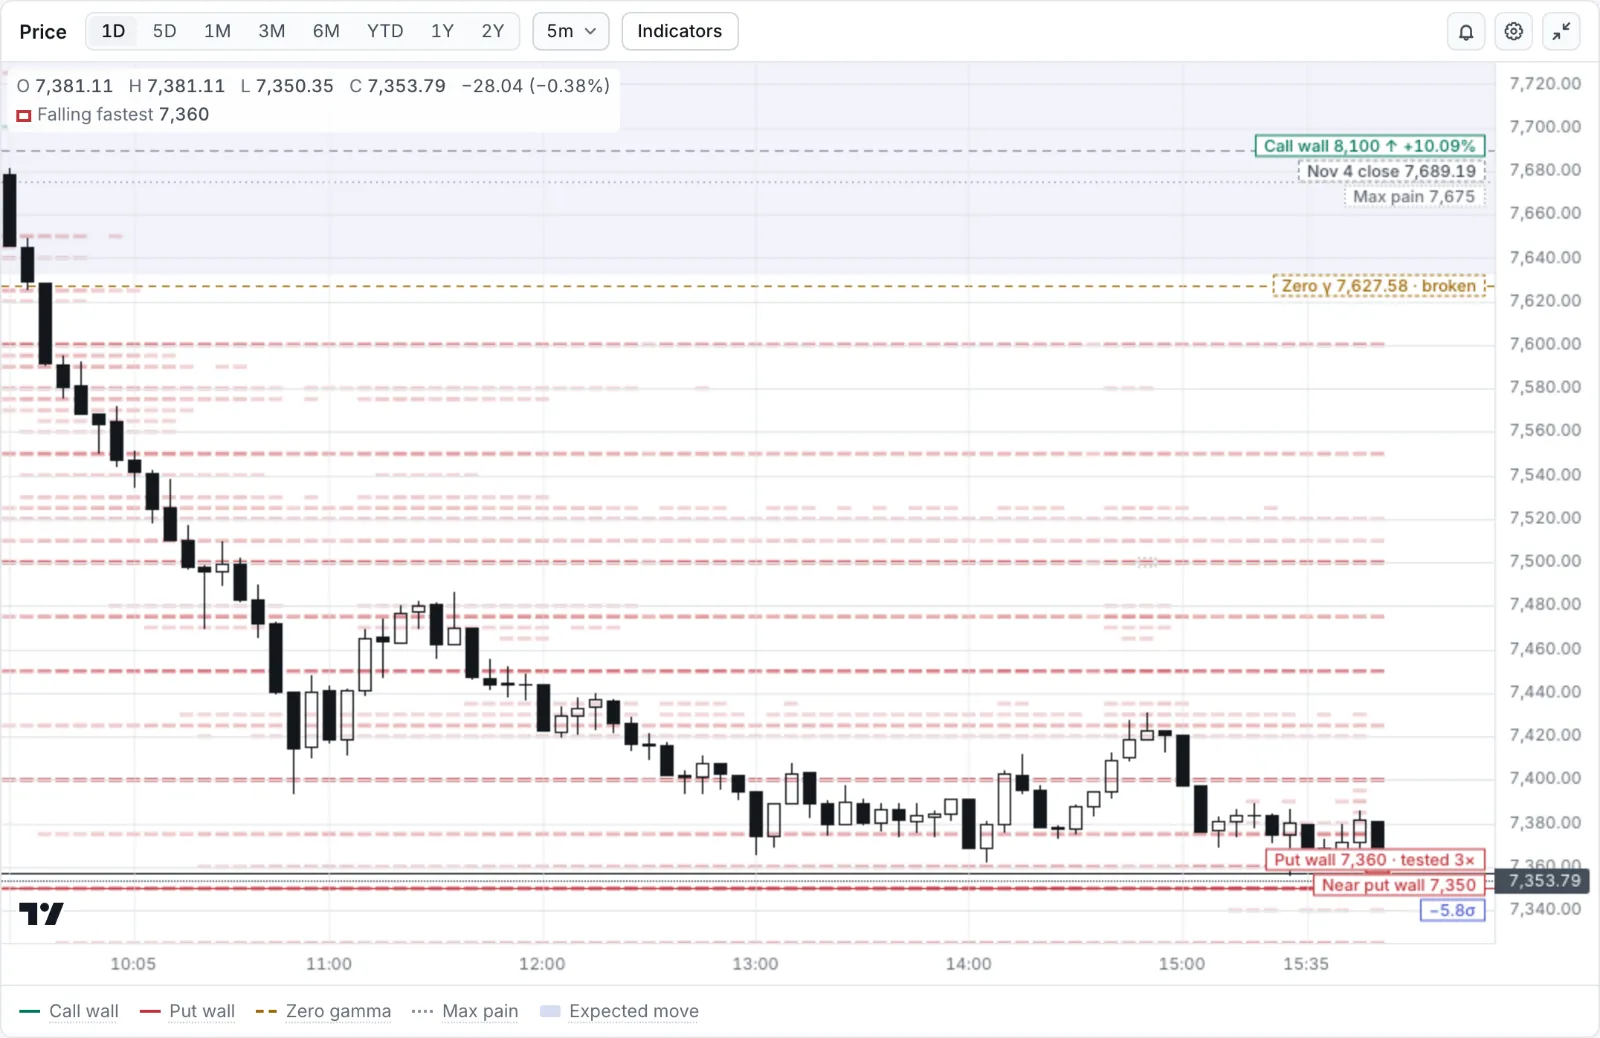
On Thu Nov 5, 2026, the 9:31 snapshot had SPX at 7,668.22 and zero gamma at 7,667.85, less than a point below. Price broke under it within minutes and never traded back up to it all day. Zero gamma itself drifted lower as the session went on (7,659.70 by 9:53, 7,627.58 at 15:59), but price fell much faster, ending 3.67% beneath it.
How traders use it
- As the line between two kinds of tape. Above it, fades and ranges; below it, follow-through and wider ranges. A tendency, not a rule.
- As a watcher. "Tell me when SPX loses zero gamma" fires on the cross itself; see watchers.
- With the distance. The Levels card gives the distance in dollars, percent, and expected moves; one expected move or more away, a cross is unlikely today.
Where the model breaks
- It's only as good as the sign convention. If dealers are actually long the puts, as can happen in single stocks, the profile's shape and its zero move.
- The profile holds implied volatility still. In a real fall implied volatility usually rises, which reshapes the curve, so zero gamma tomorrow won't be where today's profile put it.
- It moves. It's recomputed with every snapshot, so it can come to price as well as price going to it.
- A cross isn't a signal on its own. Nov 5's cross in the first minutes was followed by a 4% fall; on another day the same cross is followed by a recovery.