Replay and what changed
Step back through any of the last 30 sessions minute by minute, with every level, the ladder, the heatmap, and the expected move as they stood, and ask what moved since a moment you name.
The 30-second read
Replay puts a ticker's overview and its positioning pages at an earlier moment of one of the last 30 sessions. Pick the session, drag the time, and the price chart, the levels with their status, the ladder, the heatmap, exposure by strike, and the expected move all show that minute. What changed answers the same question in words, for Athena and your AI app: "what changed in SPX since 10:30?" or "since yesterday's close?".
On the desk
Thu Nov 5, 2026 · SPX
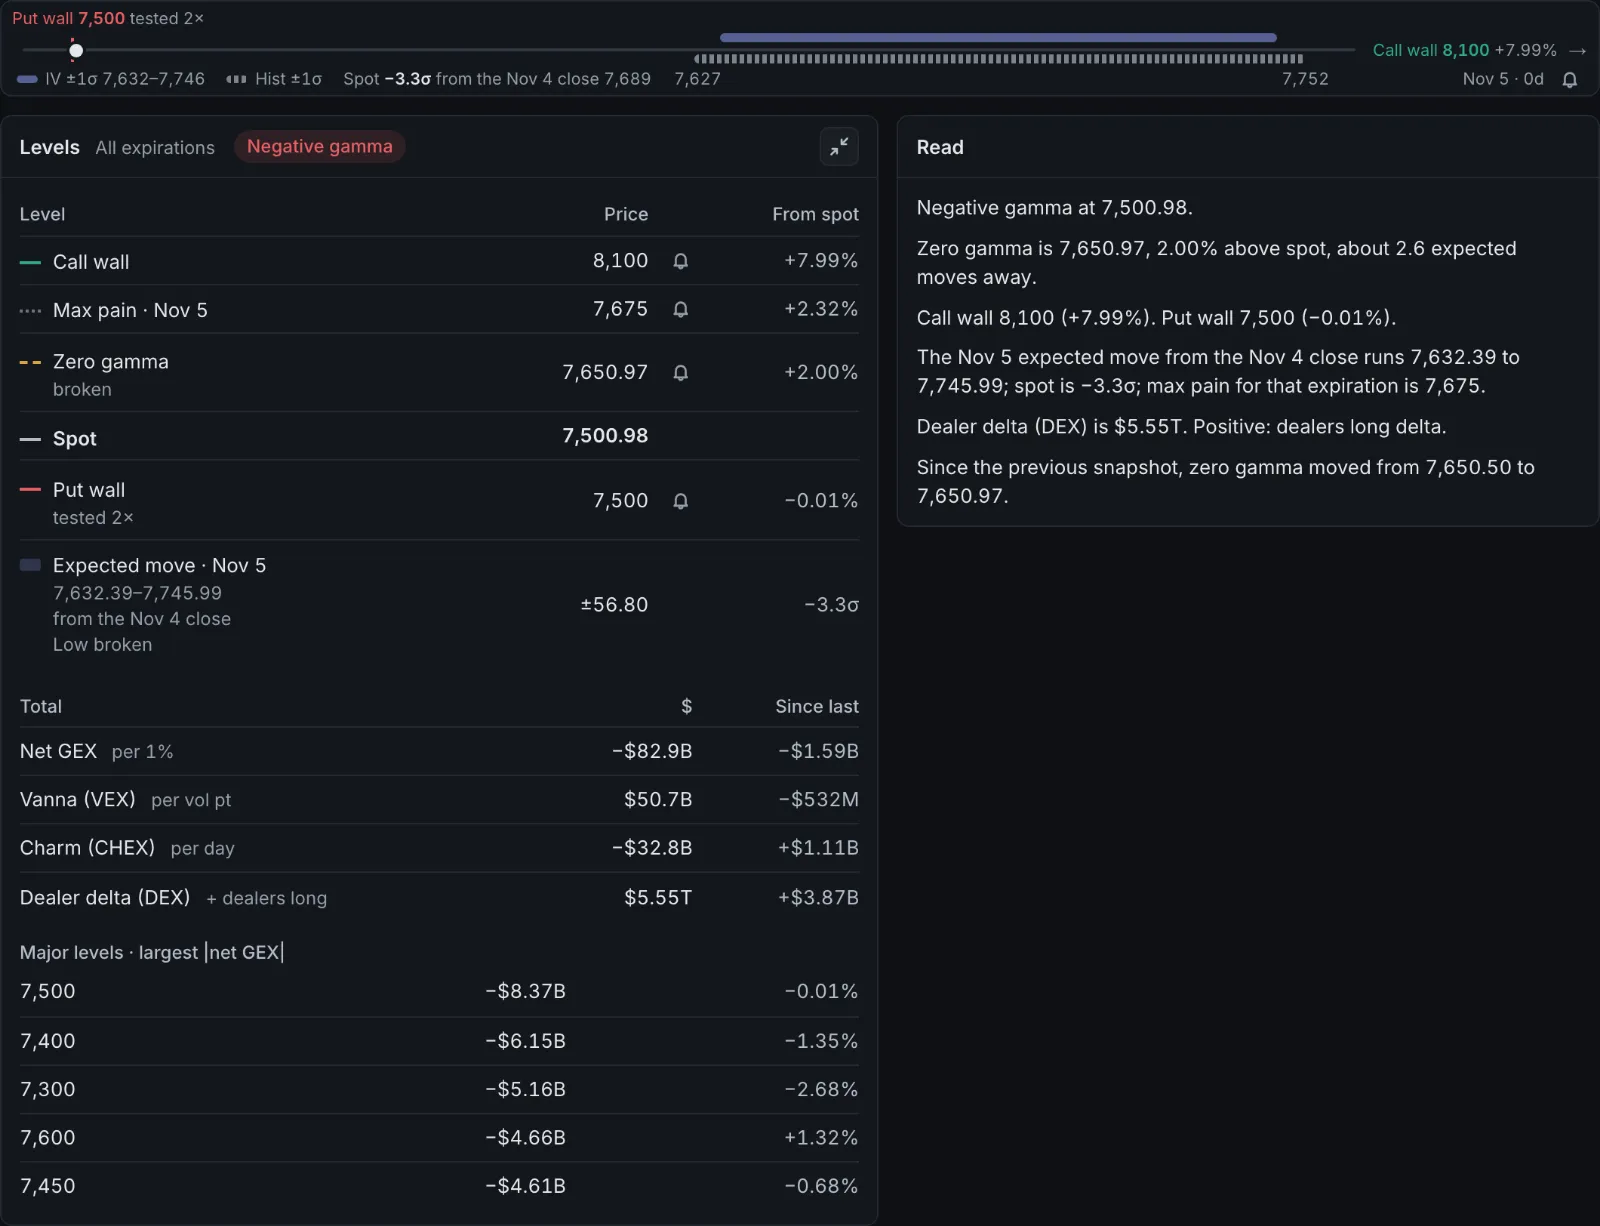
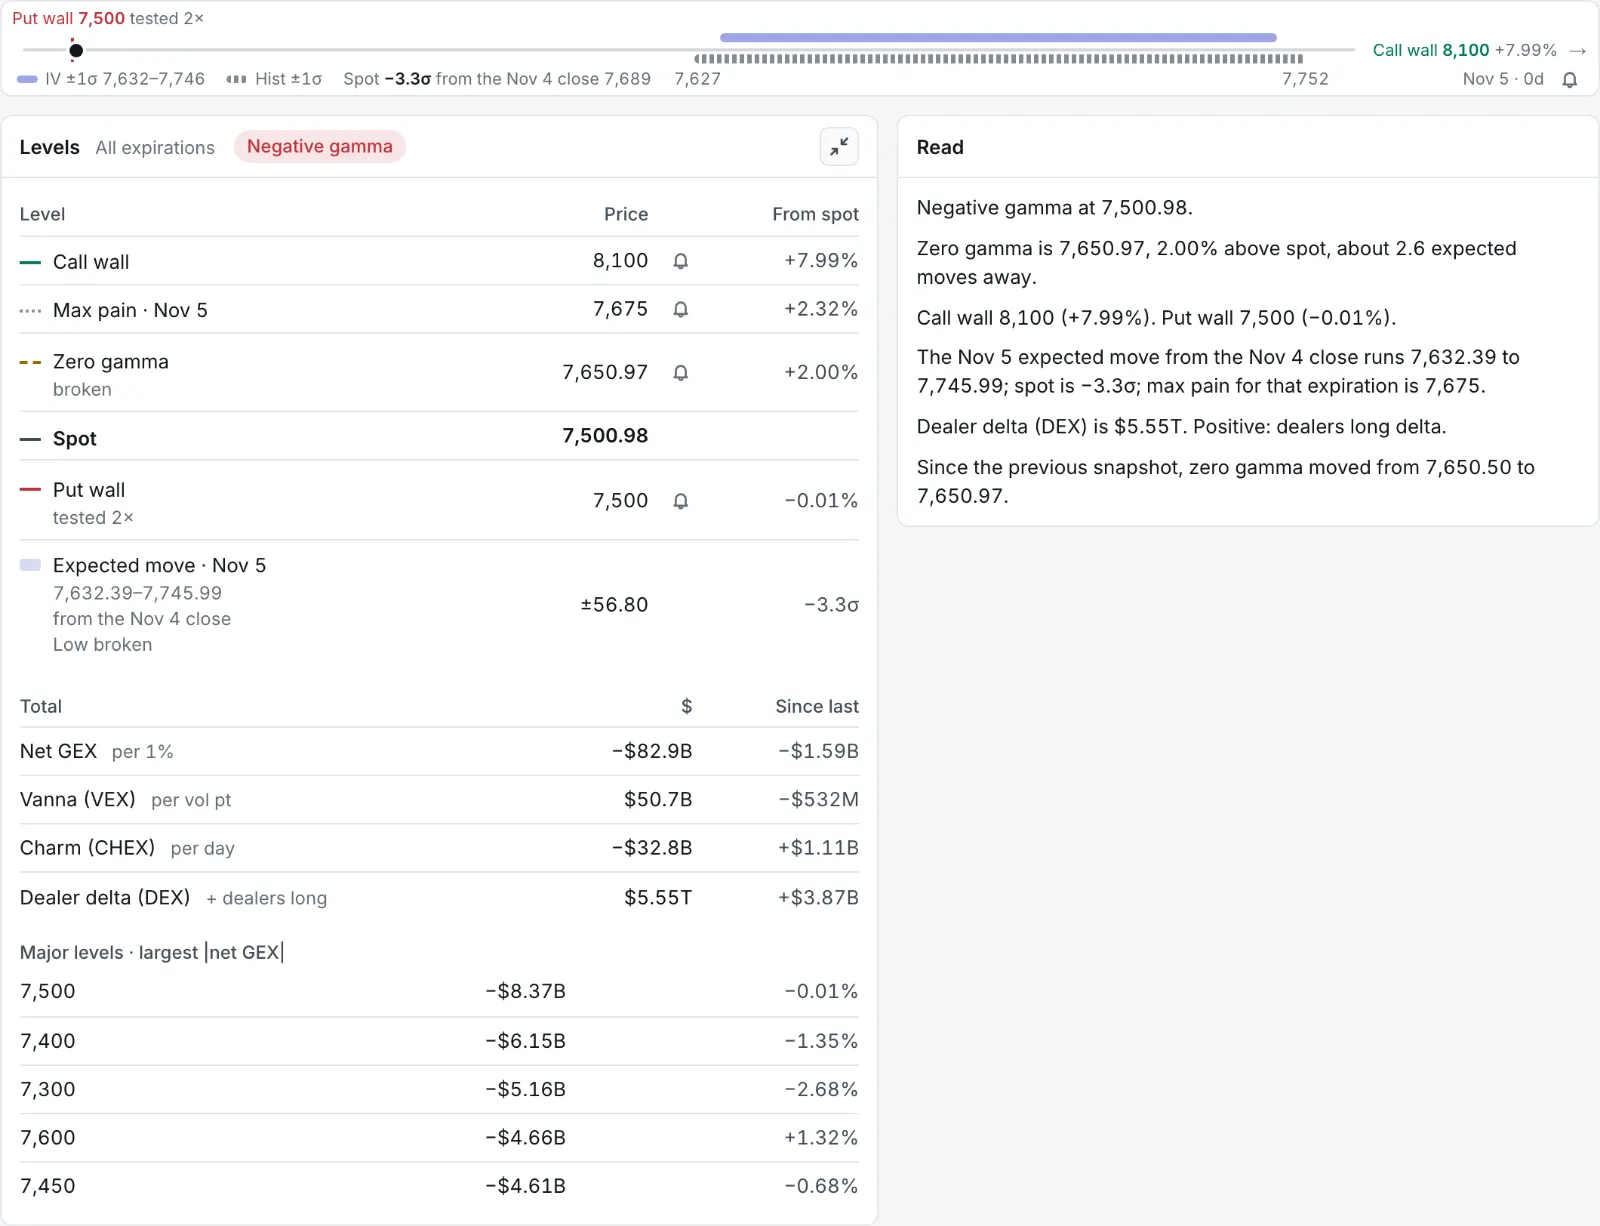
At 10:35 ET the replay showed SPX at 7,499.65, the levels from the 10:33 snapshot: zero gamma 7,650.97, already crossed below (price went under it in the first minutes and stayed), the put wall 7,500 tested twice, and the call wall 8,100 untested.
From 10:30 to 14:00 (the 10:27 and 14:00 snapshots), what changed was:
- Price 7,480.19 to 7,390.74 (−89.45). Gamma stayed negative.
- Zero gamma fell 14.23 to 7,633.07.
- The put wall moved from 7,500 to 7,400; the call wall held at 8,100.
- Total gamma −$86.1B to −$107B.
- Among the largest strikes: 7,400 building −$6.29B to −$7.36B; 7,500 fading −$8.12B to −$6.88B.
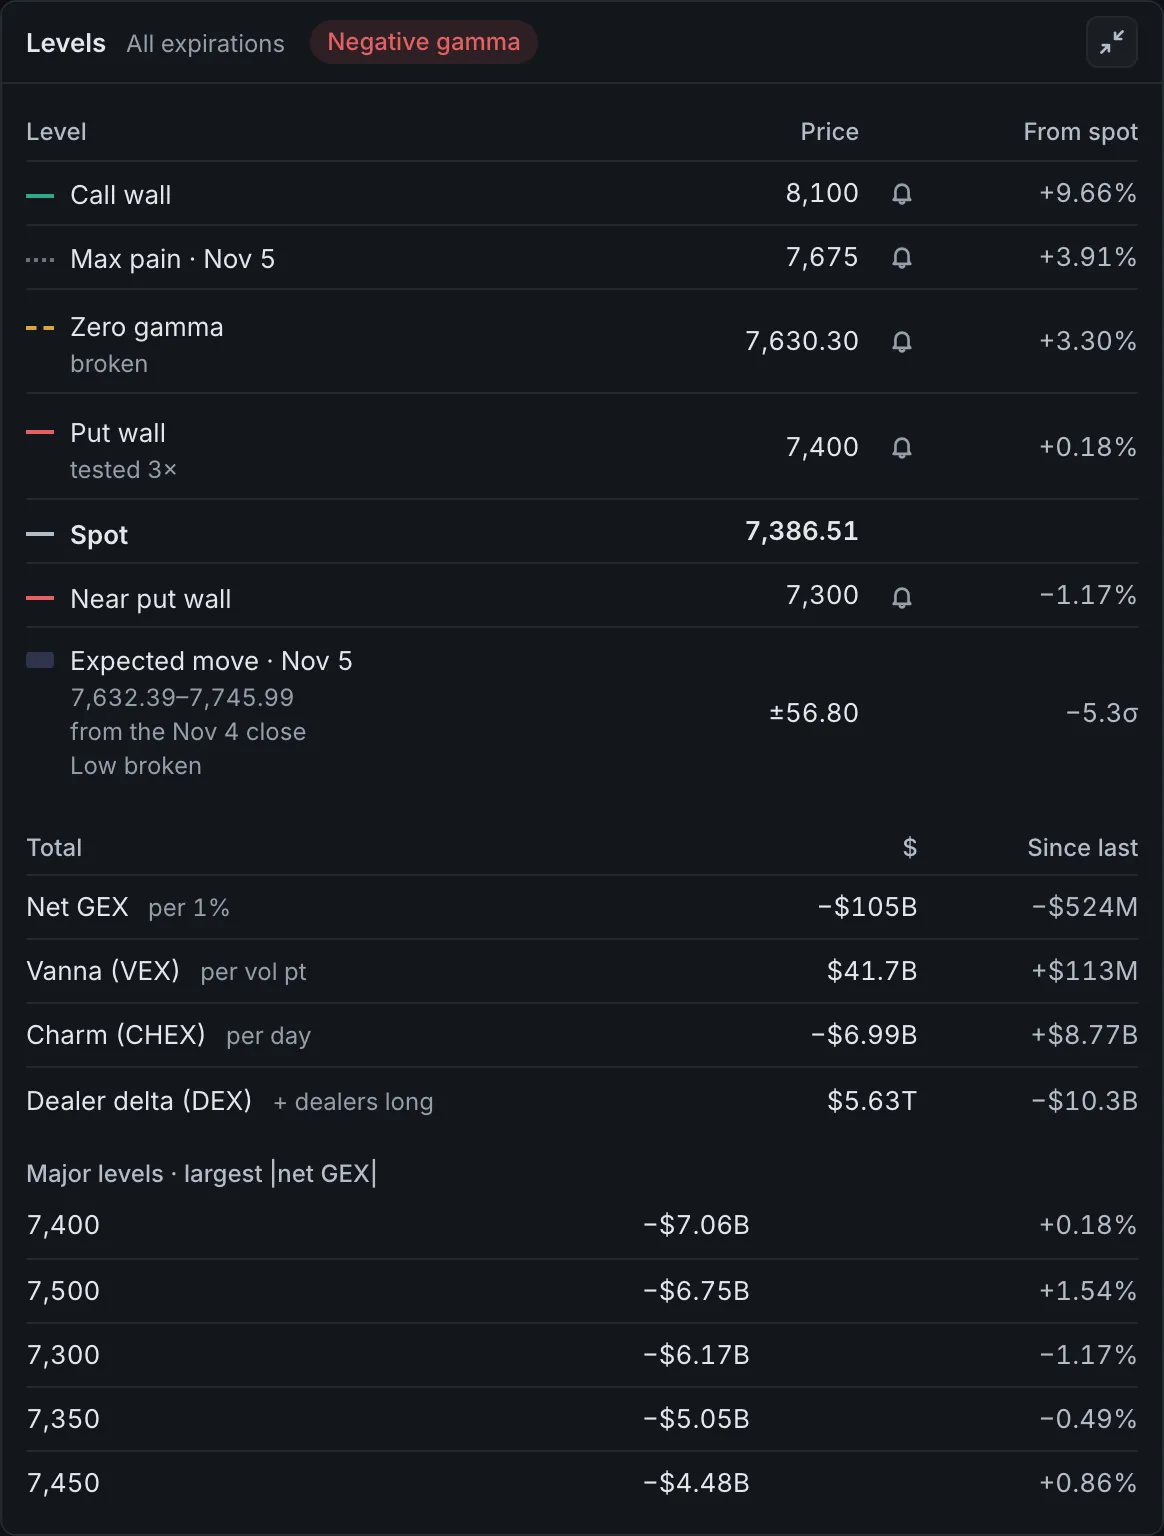
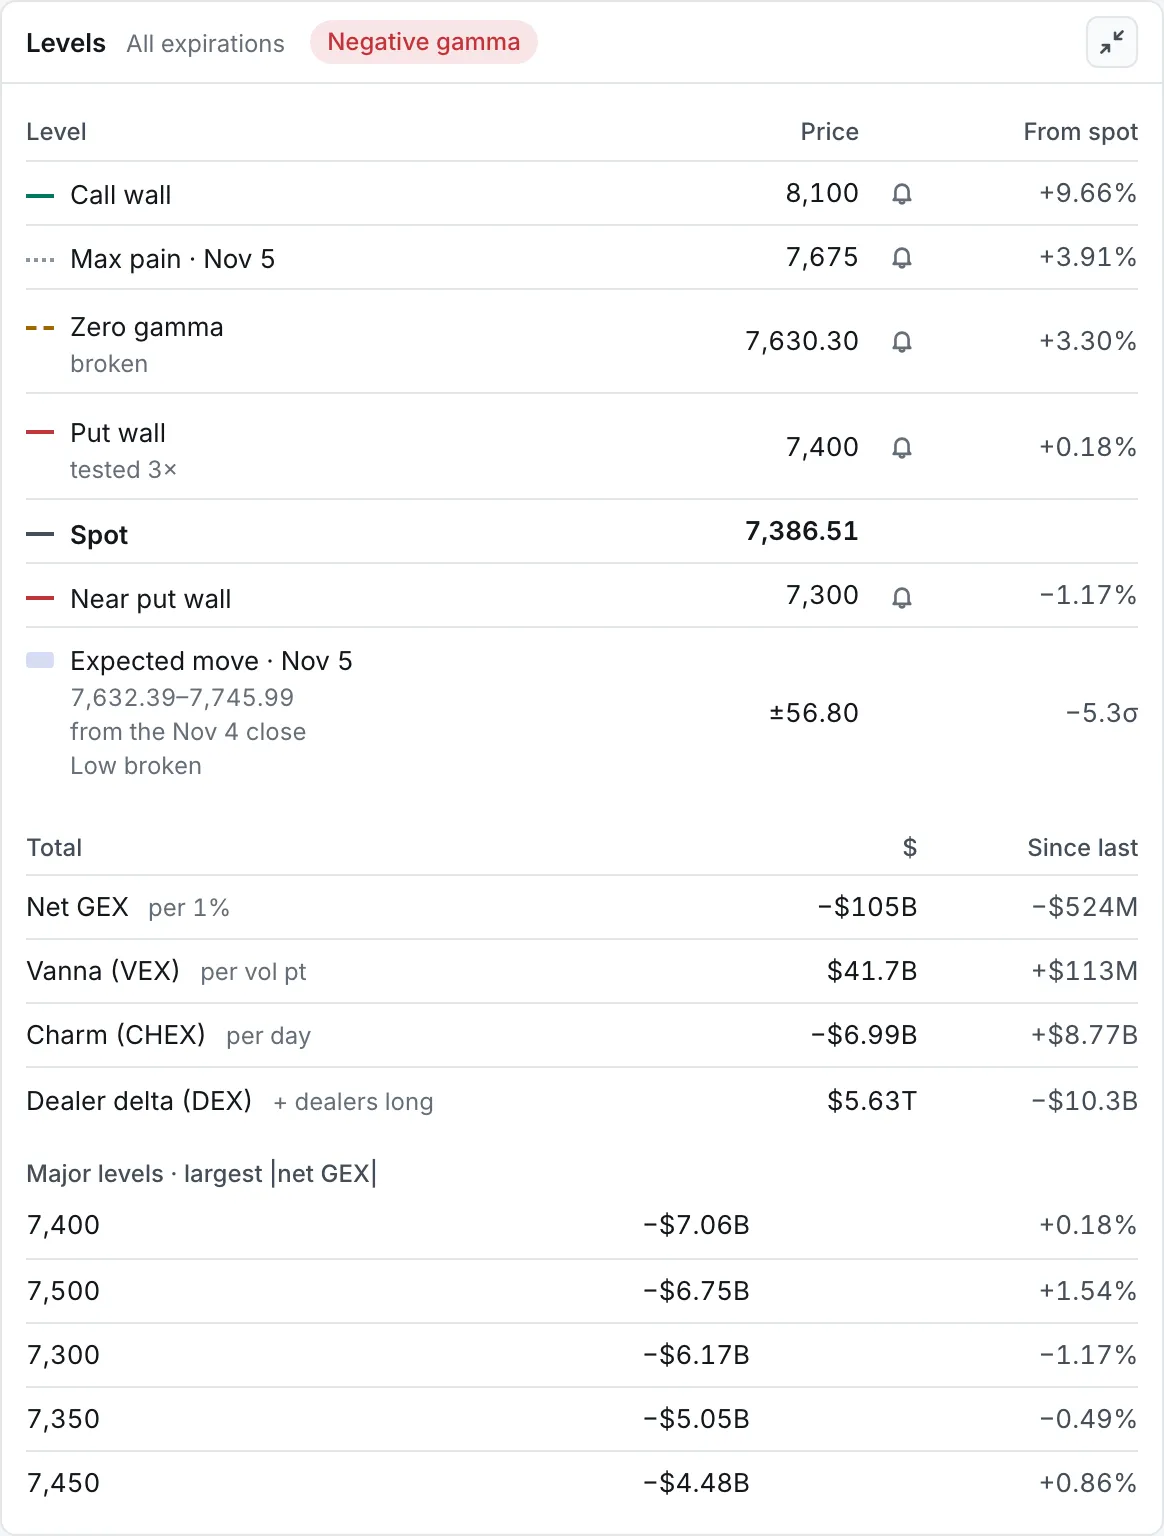
- The 7,400 wall crossed below at 13:19 ET, after 3 tests.
Stepping the replay to 13:35 shows the same wall as tested 3 times, not yet crossed: a cross counts once price has held past the level for 15 minutes.


How to read it
- Open it. Open the settings menu (the cog) on any panel of the overview, the price chart, the heatmaps, exposure by strike, the levels, or max pain, and choose Replay SPX… at the top. It opens at the session's first minute. A page in replay has the Replay bar across the top; Back to live leaves it.
- Pick the moment. The session menu lists the last 30 sessions. Drag the time along the session's price line, or use the keys on it: ← and → a minute, Shift with them 15 minutes, Page Up and Page Down an hour, Home and End the session's ends. On a phone, tap or drag the line.
- Play it. Play runs the session at 1× (a minute a minute), 5×, or 30× (a minute every 2 seconds). Space or K plays and pauses.
- Read the panels as they stood. Every positioning panel shows the snapshot at or before the minute. Snapshots come about every 5 minutes, so when the time shown is between two, the bar says which one the levels are from ("Levels as of 10:33 ET"). The price chart shows the candles complete by the minute.
- Share it. The address carries the minute (
?at=2026-11-05T10:35, Eastern time), so a bookmark or a link opens the same moment. - Ask what changed. In Athena or your AI app, name the ticker and the earlier moment: the open, the prior close, a date (its close), or a time. The answer names zero gamma's shift, the walls, whether gamma flipped, the strikes whose gamma changed most, and each level as it stood then, with whether price tested it or crossed above or below it since, and which side of max pain price is on.
Where the model breaks
- 5-minute positioning. The levels, the ladder, and the heatmap are kept every 5 minutes, plus each session's first and last snapshot. A minute between two reads the one before it. Price is kept every minute.
- 30 sessions. Replay and what changed reach the last 30 sessions. Until 30 sessions have been kept, they reach as far as is kept.
- The levels as they were computed then. Open interest is the morning's all session, so a strike's change during the day is price, time, and implied volatility moving, not new positions.
- Same model as the live levels. Replay shows what the levels said at the time, with the same assumptions and the same limits.
What changed, in detail
- The two moments. The earlier is the open (the session's first snapshot), the prior close, a session's date (its close), or a time in Eastern time. The later is now, unless you name one.
- The strikes. Up to five whose gamma moved most, each past the floor that keeps flicker out (the same rule as levels in motion): building, fading, or flipped.
- The levels since. Each level as it stood at the earlier moment, judged over price from then: untested, tested (how many times, and the latest), or crossed above or below (through it from the side price started on and held for 15 minutes). Max pain says which side of it price is on instead.
Plans
Replay and what changed are on Pro, as earlier moments are. On Free, Replay in a panel's settings says so, and a replay link opens the page as it is now.