Market drift
Net premium drift added up across the 50 tickers with the most option volume, against SPY, by ticker and by sector: where the whole options market leaned through the session.
The 30-second read
Market drift adds up net premium drift across the 50 tickers with the most option volume, a minute at a time from the open, against SPY's price. It answers whether the options market as a whole is paying up for calls or for puts today, and which names and sectors are doing it.
On the desk
Thu Nov 5, 2026 · the top 50 by Wednesday's option volume
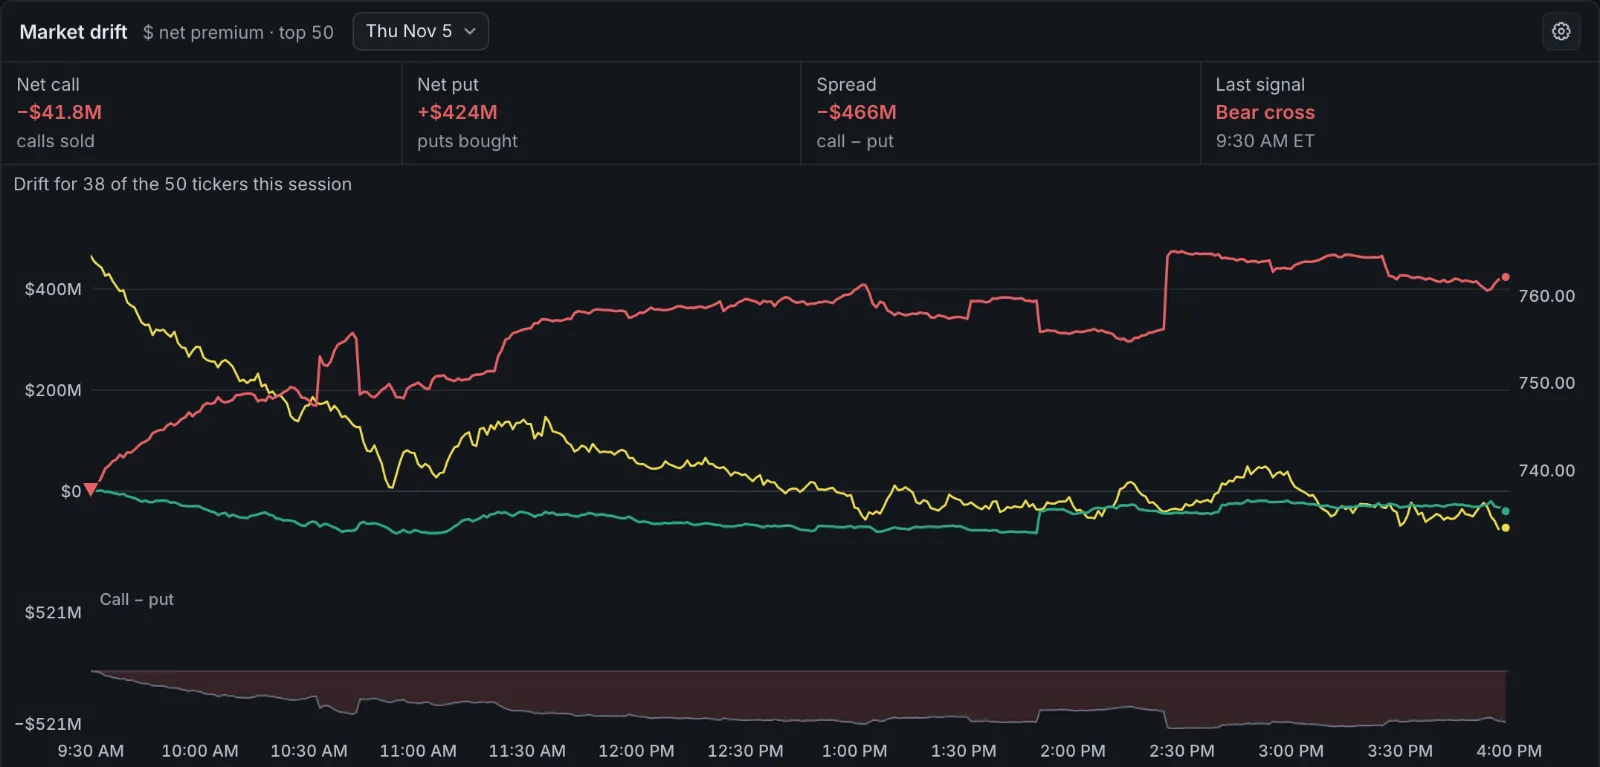
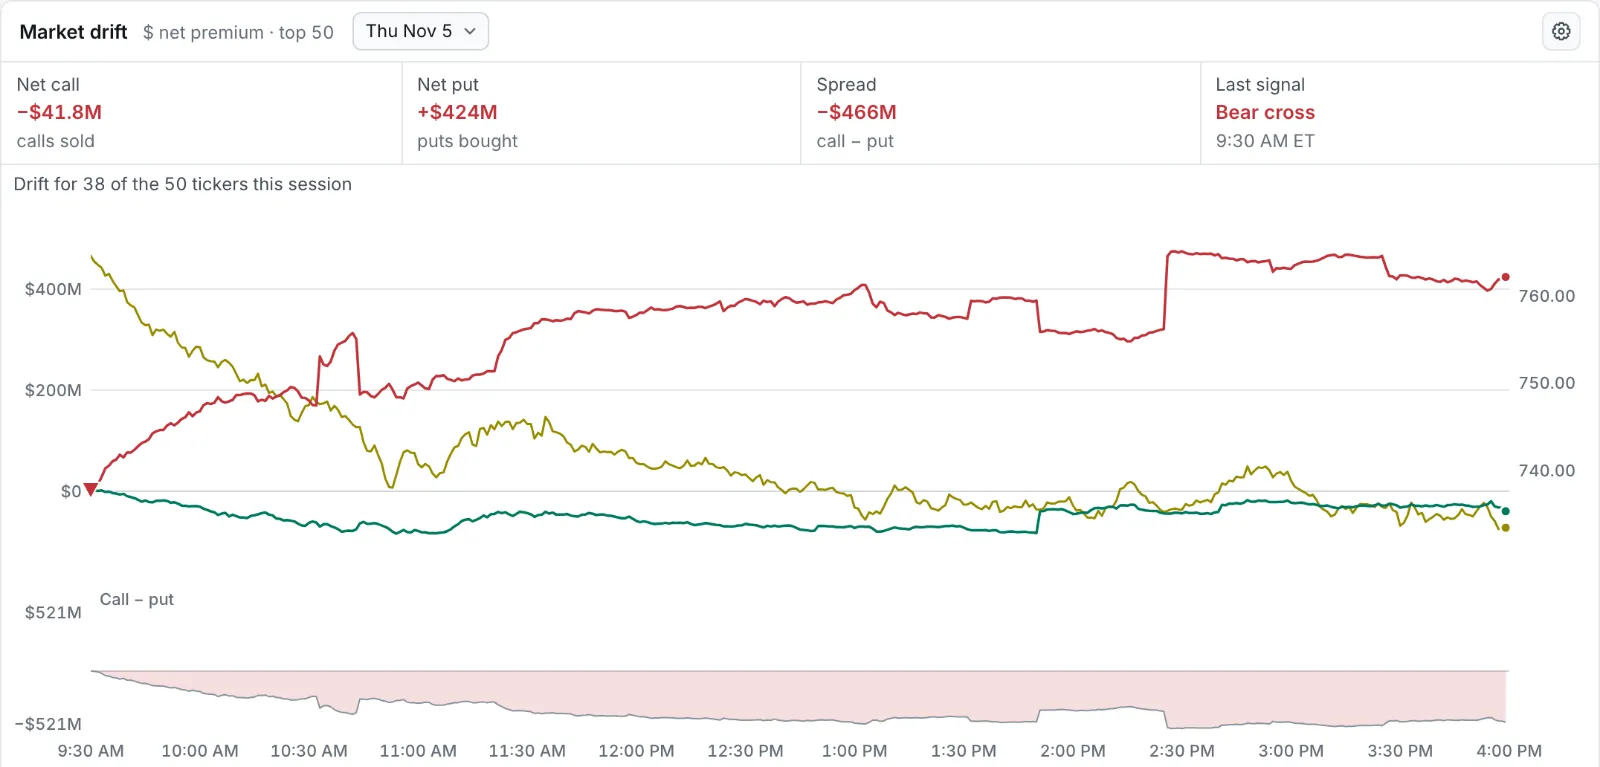
The money leaned to puts from the first minute: a bear cross at 9:30 and no bull cross all day. Net put premium closed at +$424M (puts bought) and net call at −$41.8M (calls sold), a spread of −$466M. Net put's biggest jump came at 2:30 PM, while SPY slid from above 760 at the open to the 730s.
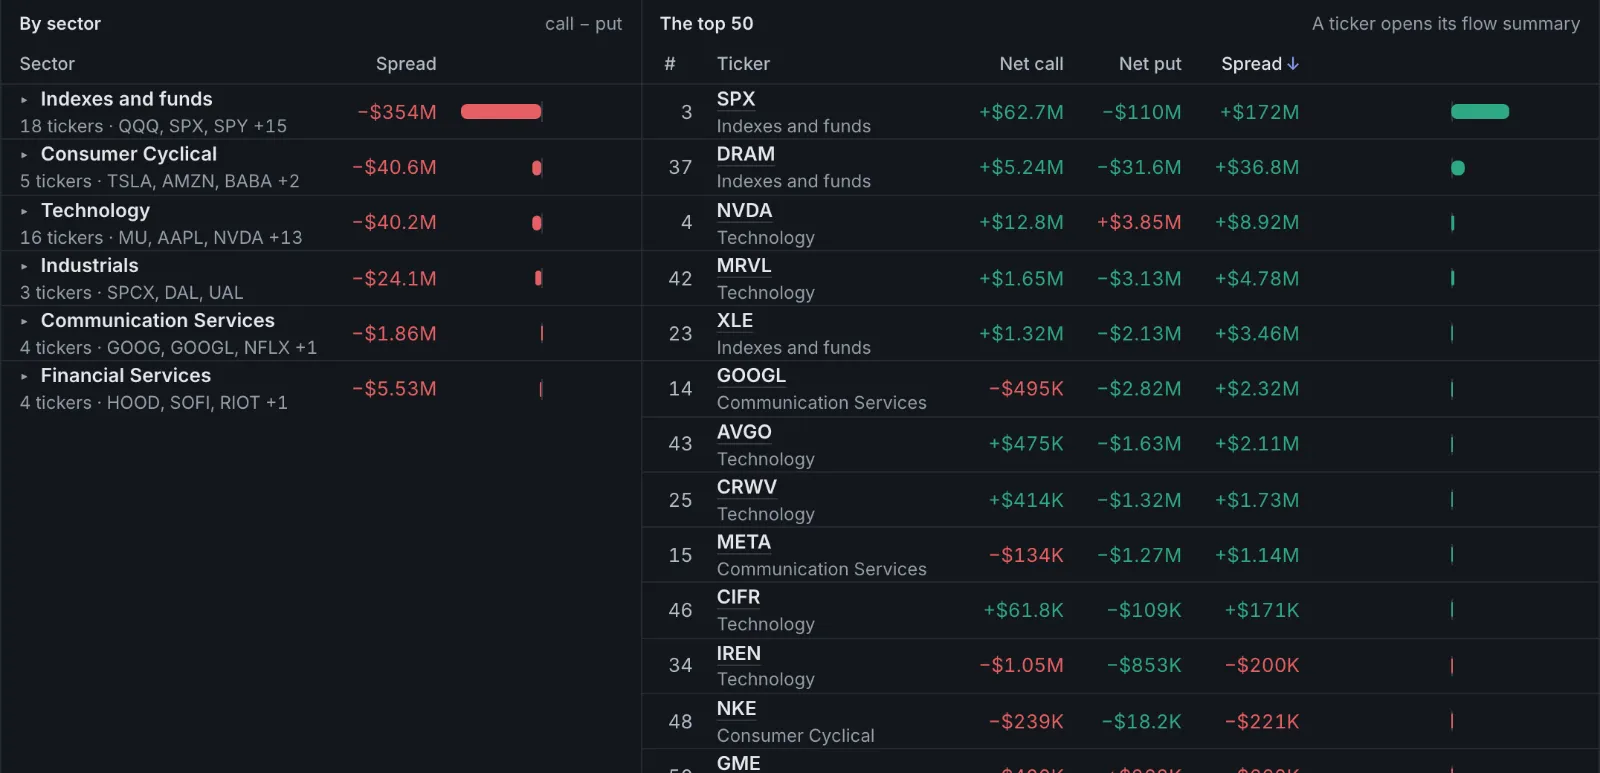
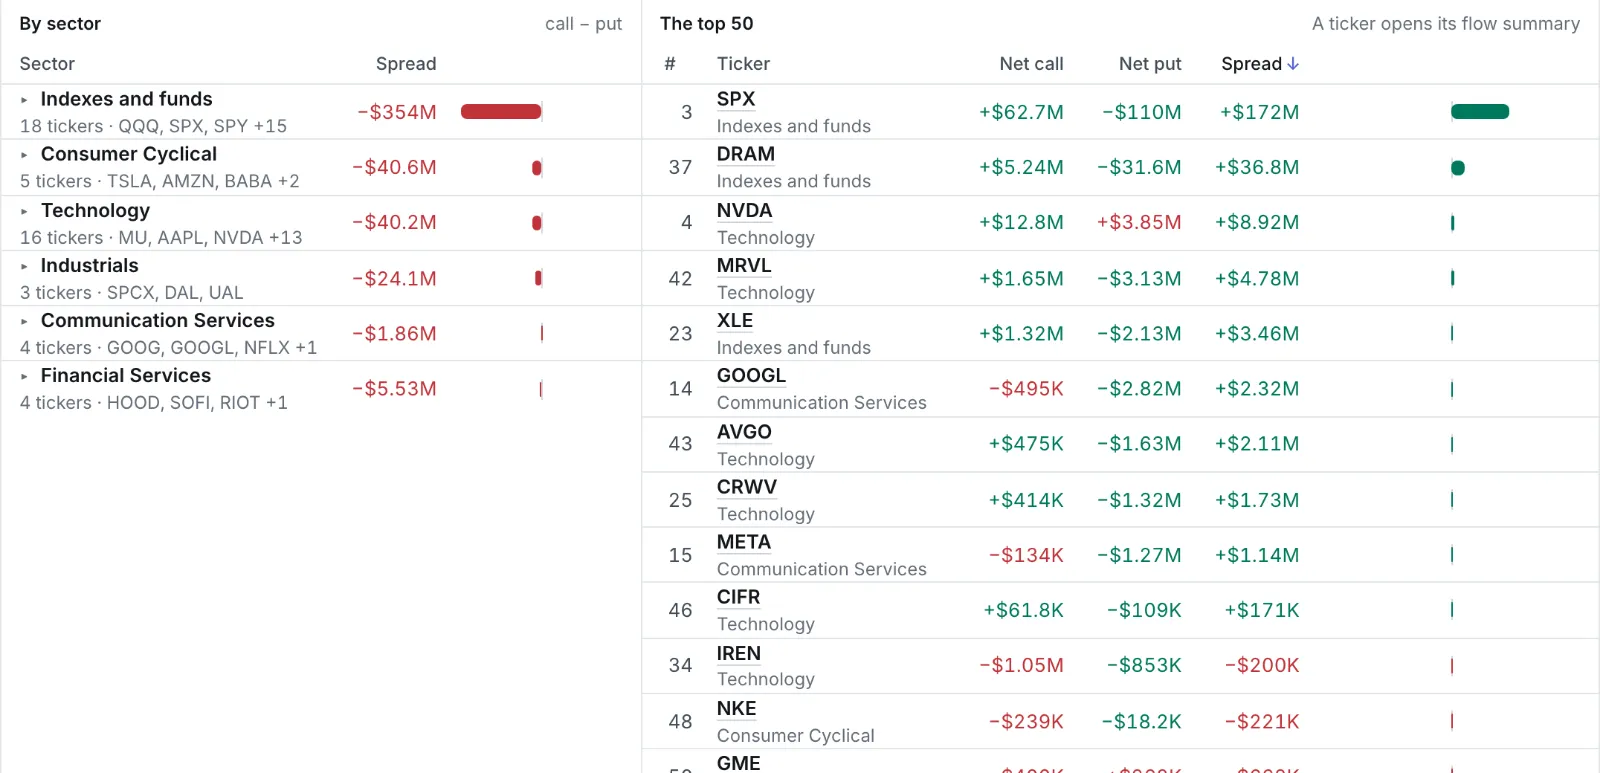
Most of it was one ticker. QQQ alone was −$384M (+$345M of puts bought), and indexes and funds together −$354M; consumer cyclical stocks added −$40.6M and technology −$40.2M. Against it, SPX read +$172M (puts sold) and NVDA +$8.92M. 38 of the 50 tickers had drift that session.
How to read it
- Read the spread first. Below zero is bearish money across the market (puts bought, calls sold); above, bullish. Its size against the premium traded says how one-sided it is.
- Find who's moving it. Sort the 50 by spread: on Nov 5 one ticker, QQQ, made more than four fifths of the market's spread. A lean that is one name is a trade, not a mood.
- Read the sectors. Indexes and funds often carry hedges; a lean that shows in the stock sectors too is broader.
- Set it against SPY. Puts bought while SPY falls is protection chasing the move; puts bought while SPY holds is positioning ahead of one.
- Then open a ticker. A ticker's row opens its flow summary: the strikes and trades behind its number.
Where the model breaks
- The side is inferred. Each trade's side comes from where it printed against the quote, as on net premium drift; index puts are often hedges, not bets.
- The 50 are the session before's. A name that spikes today joins tomorrow, so the list holds still through the day and the line never jumps when one joins.
- VIX is left out. Its calls are bought when traders fear a fall, so they'd count as bullish money backwards.
- A session before market drift was counted adds up the tickers whose drift is stored, and says how many ("Drift for 37 of the 49 tickers").
- Premium isn't size of position. A $384M spread in QQQ and a $9M spread in NVDA are both real, but the market's total is mostly the big index products.
What it counts
Market drift (/SPX/market-drift, the same from any ticker) is each of the 50 tickers' own net premium drift, at its defaults (every moneyness, expirations within 45 days), added up minute by minute. A ticker's row in the table is exactly what its drift page shows for the session.
The 50
The 50 underlyings with the most option contracts traded in the session before, most first, with VIX left out. They are chosen once, before the open, and hold all session.
The page
- The strip: net call, net put, the spread, and the last signal across the 50, as on drift.
- The chart: net call (green) and net put (red) with SPY's price (yellow) on the right axis, the crosses marked, and the spread under it.
- By sector: each sector's spread, indexes and funds together; press a sector to see its tickers.
- The top 50: each ticker's rank, net call, net put, and spread, sorted by spread (press Spread to flip it, # for the ranking). A ticker opens its flow summary.
- Session: today's, the last session, or an earlier one within a year.
While the session is open the page follows it every 30 seconds.