The index board
SPX, SPY, QQQ, and IWM side by side: each one's dealer gamma, zero gamma, walls, and expected move, whether the four agree, and the VIX curve against the prior close.
The 30-second read
The index board puts the four index tickers on one screen: SPX, SPY, QQQ, and IWM. For each you get the price and its change since the prior close, whether dealer gamma is positive or negative (the gamma regime), how far price is from zero gamma, the call wall and put wall, the expected move, net GEX, and a small gamma profile. Above them, one line says whether the four agree. Below them, the VIX curve.
On the desk
Fri Nov 6, 2026 · SPX, SPY, QQQ, and IWM at the close
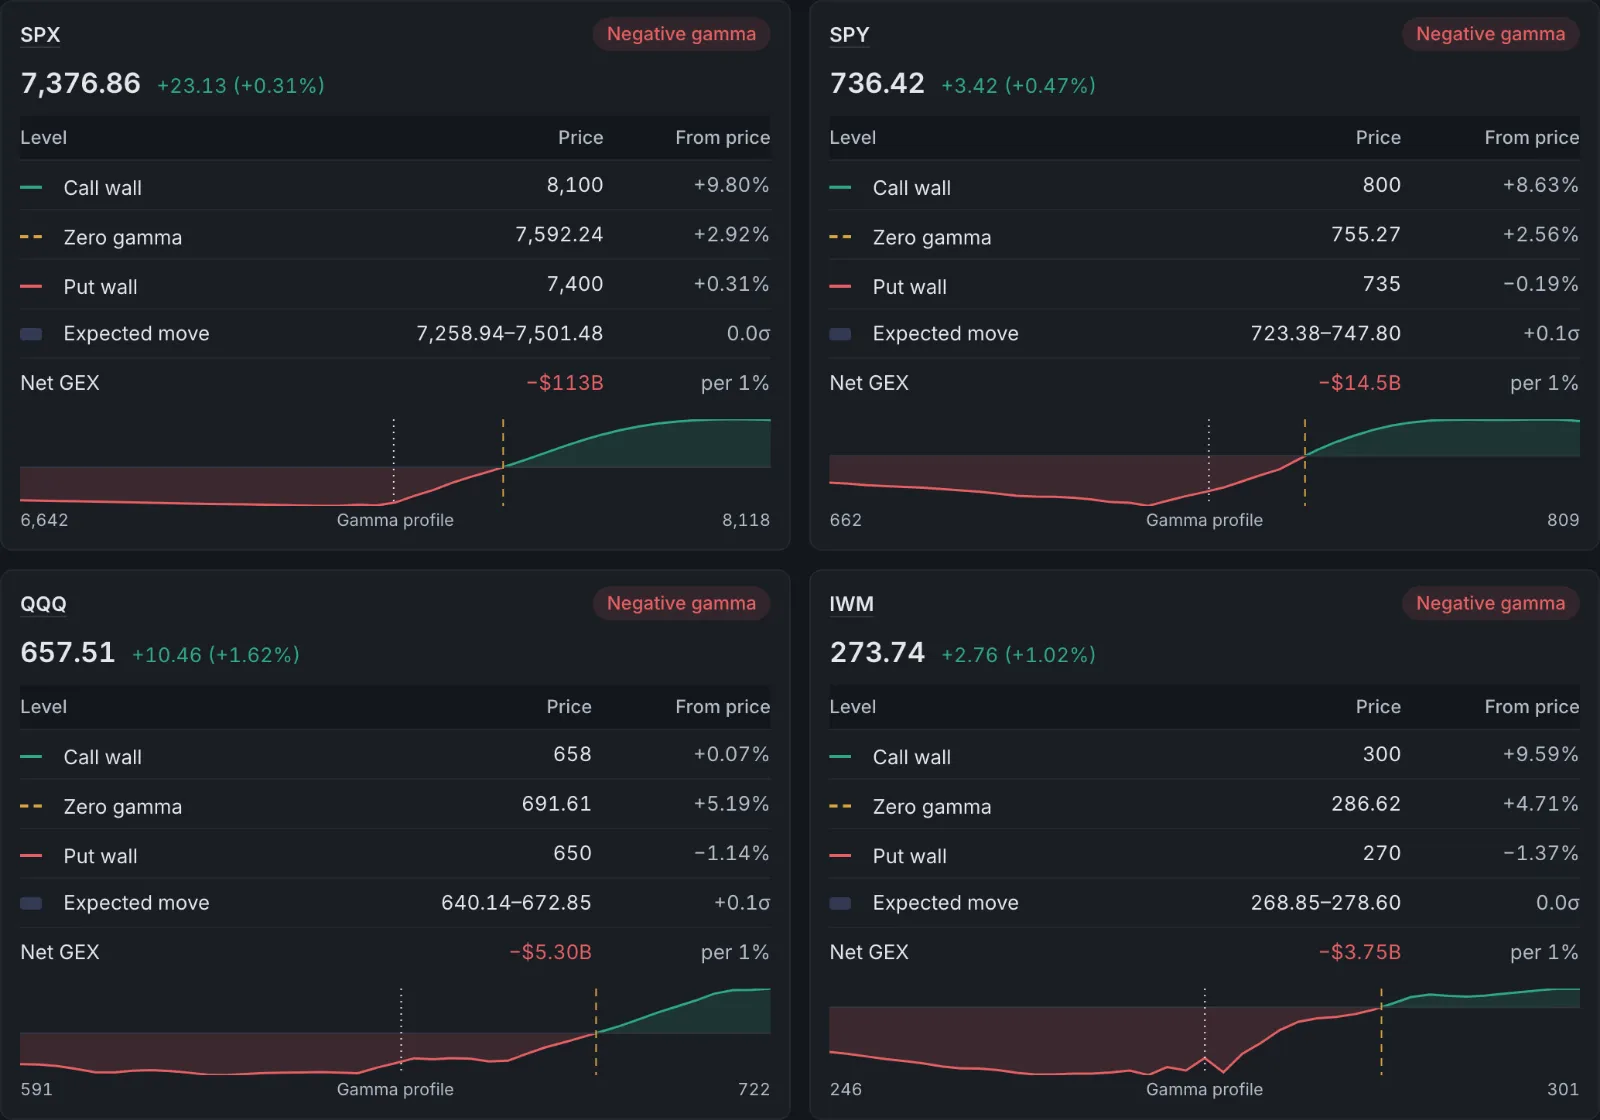
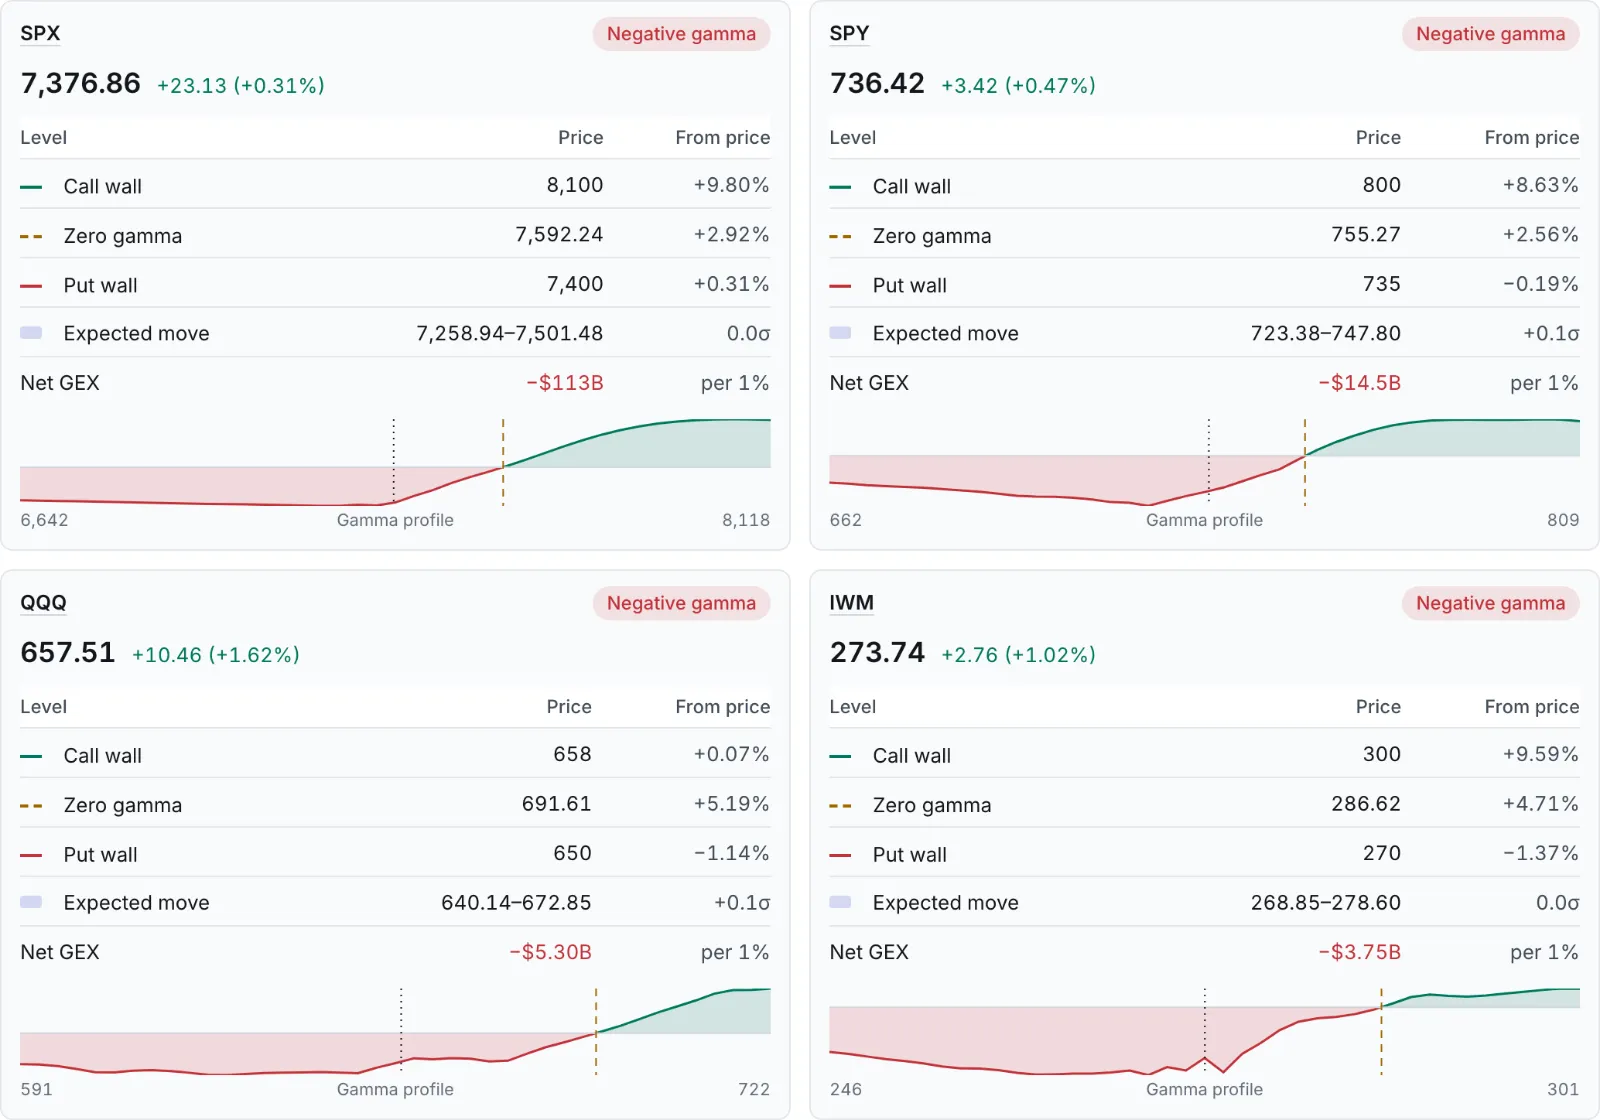
The board read All four negative gamma:
| Index | Price | Zero gamma | Call wall | Put wall |
|---|---|---|---|---|
| SPX | 7,376.86 | 7,592.24 (+2.92%) | 8,100 | 7,400 |
| SPY | 736.42 | 755.27 (+2.56%) | 800 | 735 |
| QQQ | 657.51 | 691.61 (+5.19%) | 658 | 650 |
| IWM | 273.74 | 286.62 (+4.71%) | 300 | 270 |
All four sat under zero gamma, SPY closest to it and QQQ furthest, with QQQ's call wall, 658, just above its price. The funds' prices are their last after-hours trades. The VIX curve's prior close, Thu Nov 5's, was inverted end to end: VIX1D 36.80, VIX9D 32.66, VIX 28.18, VIX3M 25.55. On Wed Nov 4 it had closed upward (12.08, 15.19, 16.61, 18.80).
How to read it
- The agreement line. "All four negative gamma" when every index is on the same side; "QQQ positive, the rest negative" when one stands apart; "SPX and SPY positive, QQQ and IWM negative" on an even split. An index without levels is named after the line.
- How far from zero gamma. The percent beside zero gamma is its distance from the price. The index nearest zero gamma is the one most likely to change sides first.
- The small gamma profile. Net GEX across prices around the current one: green where dealer gamma is positive, red where negative. The dashed amber line is zero gamma, the dotted line the price.
- The VIX curve. VIX1D (1 day), VIX9D (9 days), VIX (30 days), and VIX3M (3 months) now, with each one's prior close dashed underneath, and VVIX (the VIX of VIX) in the table. Inverted means VIX is above VIX3M. Front inverted means VIX is at or below VIX3M, but VIX1D is above VIX9D or VIX9D above VIX: near-term options cost more than later ones. In the session the values update every minute; one that's more than a few minutes behind shows its own time, and the column reads Latest instead of Now.
- The expiration set. All expirations by default. On Pro the board also reads 0DTE, the week, or the next 30 days, each index on its own dates.
Where the model breaks
- The same model as every level. Each index's figures are its own positioning, with the same assumptions as the levels. SPY and SPX hold different contracts, so their walls don't always line up after scaling.
- Agreement is about sign, not size. Four negative readings can be one large and three barely below zero. The distances and net GEX say how strongly.
- VIX1D is jumpy. It measures one day of options and swings with the day's news, so the front often inverts for a day around an event.
Plans
Free shows the whole board 15 minutes delayed, on all expirations; Pro is real time, with the levels at the latest price and the 0DTE, week, and month sets. Athena and your AI app read the same board through one tool.