Flow summary
One ticker's large option trades in a session at a glance: premium by strike, trades that paid up, contracts hit again and again, and orders larger than open interest.
The 30-second read
The flow summary reads one ticker's large option trades ($100K or more) in a session four ways: where the premium went by strike, which trades paid up to get filled, which contracts traders kept coming back to, and which orders were bigger than the contract's open interest. Under it, the ticker's net premium drift shows the whole day's money.
On the desk
Thu Nov 5, 2026 · NVDA
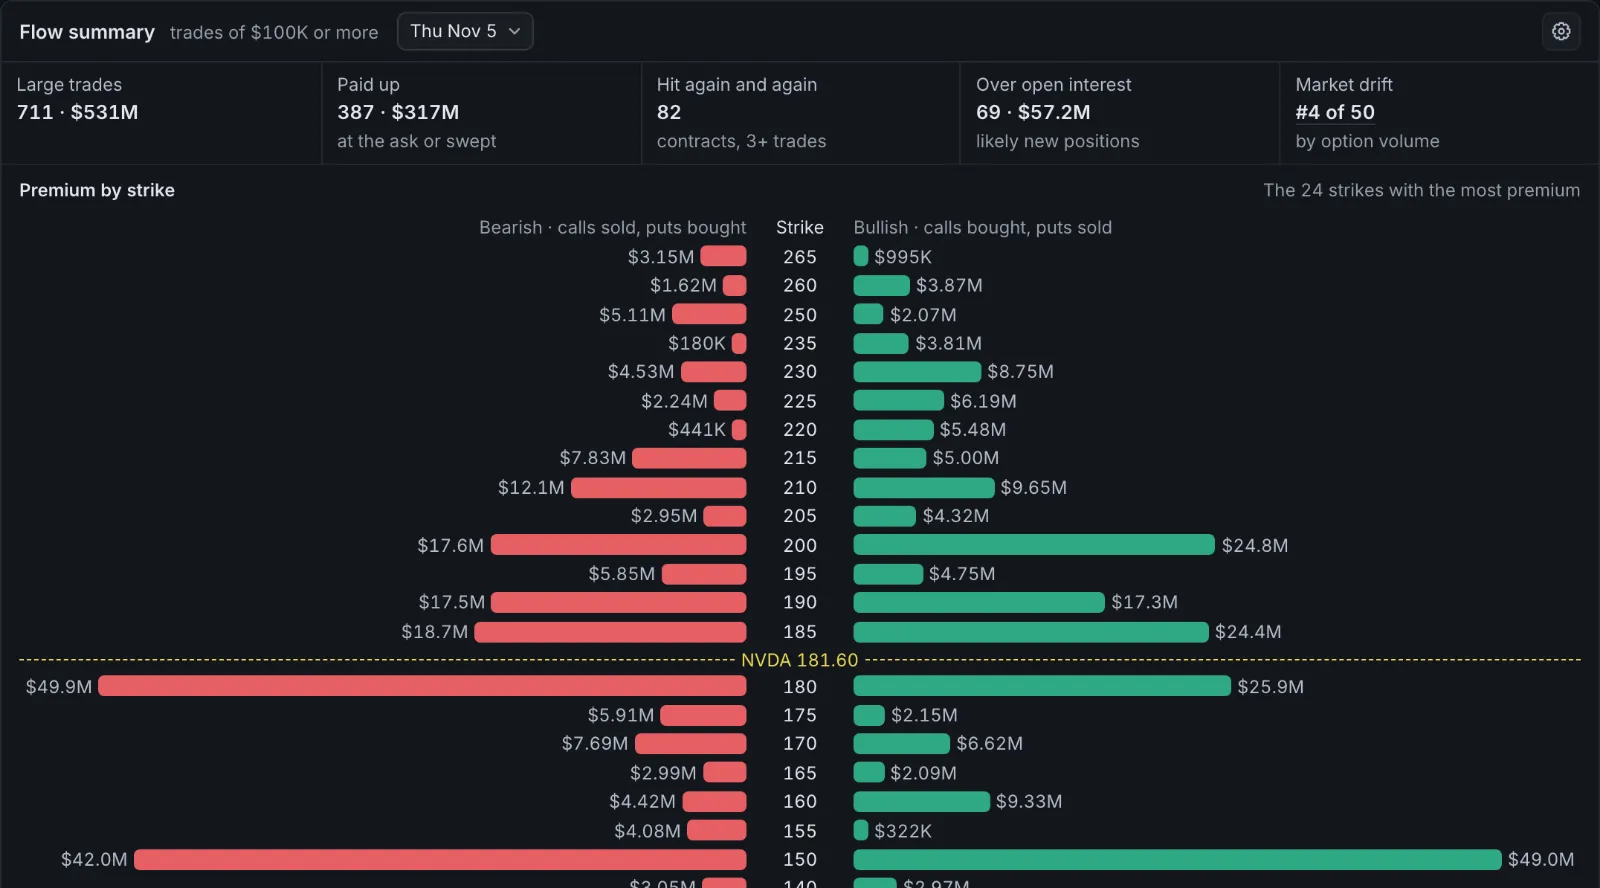
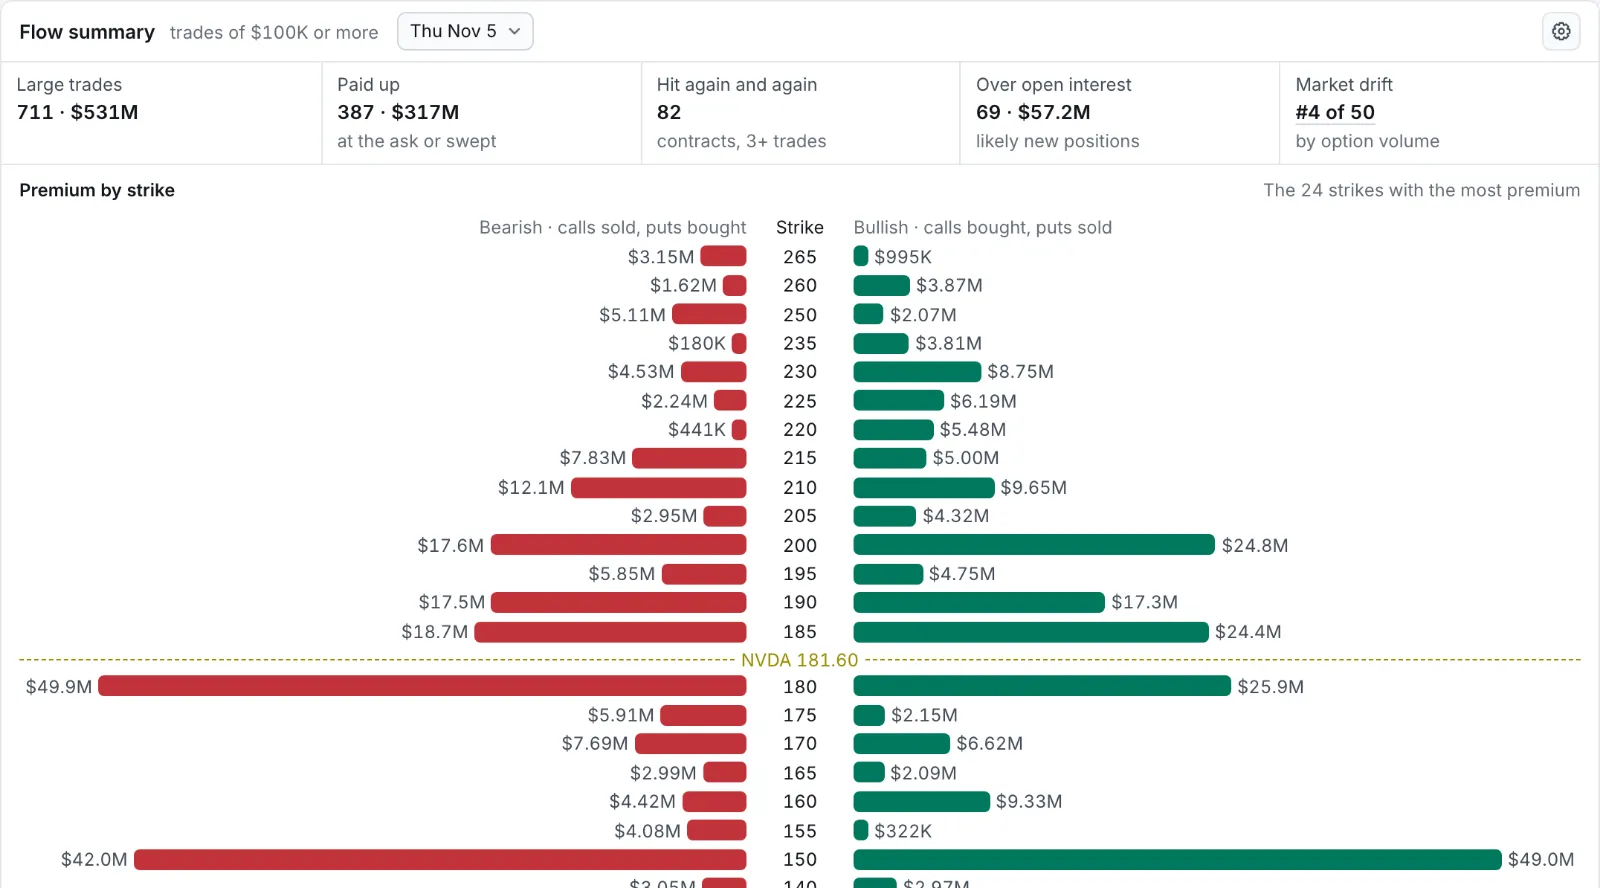
NVDA had 711 large trades for $531M, #4 of the day's top 50 by option volume. 387 of them, $317M, paid up: at or above the ask, or swept. 82 contracts were hit three times or more. The one with the most money was the Jan 15 '27 180 call, hit 15 times from 9:49 to 15:41 for $51.9M, mostly sold (bearish), 9 of the 15 paid up; the Jan 15 '27 200 call was hit more often, 16 times, for $3.65M.
By strike, 180 leaned furthest: $49.9M bearish (calls sold and puts bought) against $25.9M bullish. At 150, $42.0M bearish met $49.0M bullish. 69 trades were bigger than their contract's open interest, $57.2M: likely new positions.
How to read it
- Start with the strikes. Green to the right is bullish premium (calls bought, puts sold), red to the left bearish; the dashed line is the price. Premium stacked at one strike near the price is a level traders are trading around.
- Weigh what paid up. A trade at or above the ask, or swept across exchanges, wanted in now; the same premium at the bid is someone selling.
- Read repeated hits as conviction or a program. The same contract 13 times in two hours is one trader building, or an algorithm working an order.
- Larger than open interest means new. An order bigger than every contract open that morning can't all be closing; at least part is a new position.
- Then read the drift under it. The big prints are part of the day's money; NVDA's drift on Nov 5 ended +$10.2M, bullish, while its large trades leaned bearish at 180 and 150.
Where the model breaks
- Large trades only. Trades under $100K or 50 contracts aren't here; drift, under it, counts every trade.
- The side is inferred, from where each trade printed against the quote. A call sold may be a covered call; a put bought may be a hedge.
- Open interest is the morning's. "Larger than open interest" compares a trade with the contracts open before the session; trades the same day can open and close.
- Packages reported late are still in Nov 5's stored flows. NVDA's 12:50 "splits", the Jan 15 '27 150 put and the Nov 20 200 call, were legs of one structure reported late, recorded before such prints were kept out. They lead Nov 5's paid-up list.
- Repeated isn't the same trader. Three hits on one contract can be three traders.
What it shows
The flow summary (/NVDA/flow-summary) reads the session's detected flows for one ticker, every expiration together:
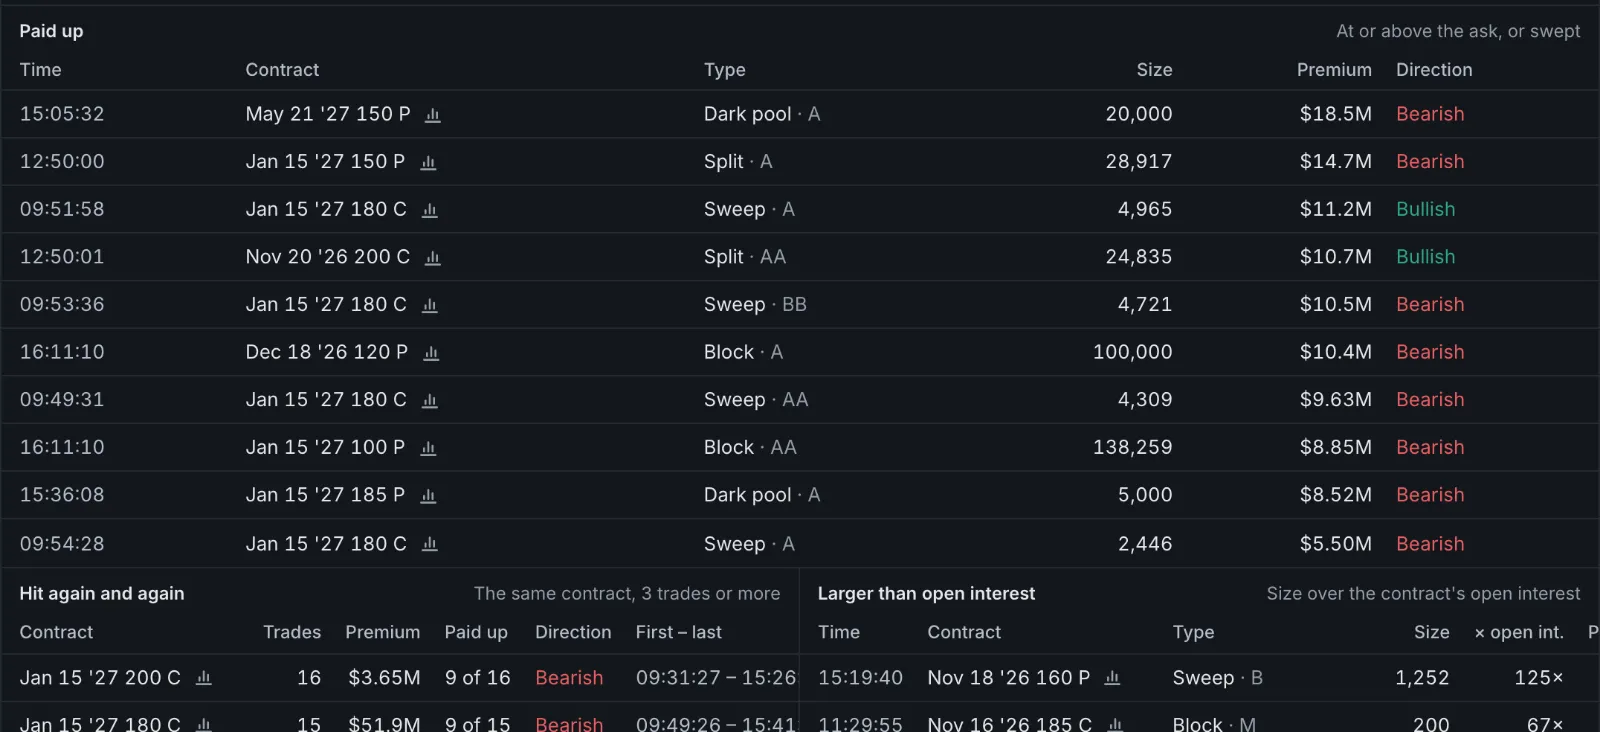
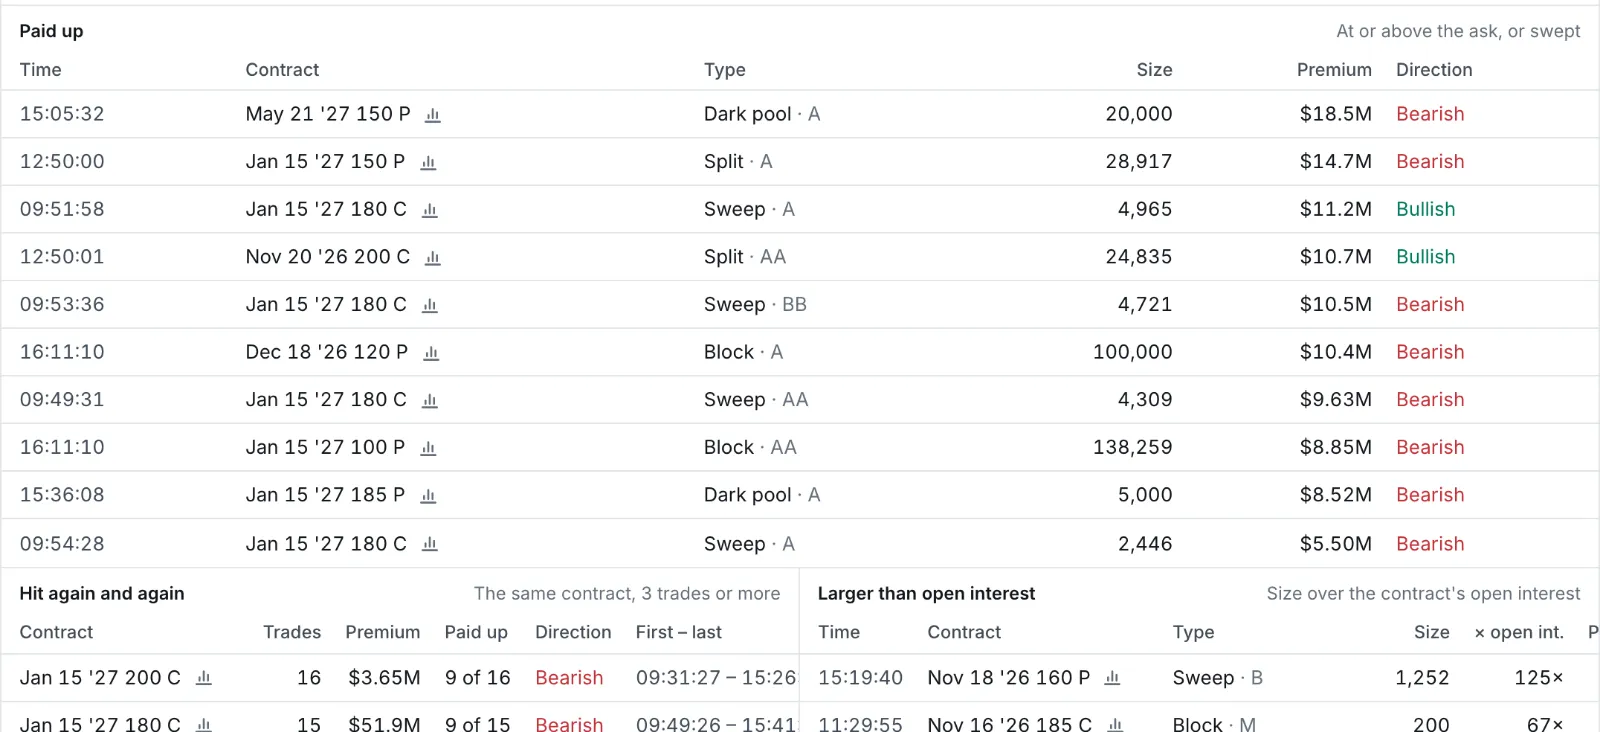
- Premium by strike: the 24 strikes with the most premium, high to low, each split into bullish and bearish premium.
- Paid up: trades at or above the ask, or sweeps, by premium, the ten largest. In all three lists the bars after a contract open its history.
- Hit again and again: contracts with 3 flows or more in the session, by how many, with their premium, direction, how many paid up, and the first and last time.
- Larger than open interest: trades bigger than their contract's open interest, by how many times larger, the ten largest.
- Market drift: the ticker's rank among the day's top 50, when it is one; it opens market drift.
Pick an earlier session in the header; the drift under it follows.