The level scorecard
How often price reached the morning's call wall, put wall, and zero gamma, closed past them, and how far it ran, per ticker over the last month to 12 months.
The 30-second read
The level scorecard counts what price did at the levels. For every past session it takes the call wall, the put wall, and zero gamma that stood at that morning's open and checks the session's high, low, and close against them: did price reach the wall, did it close past it, how far did it run? Then it adds the sessions up over the last month, 3, 6, or 12 months. Each figure is a count of sessions, so you see how many it stands on.
On the desk
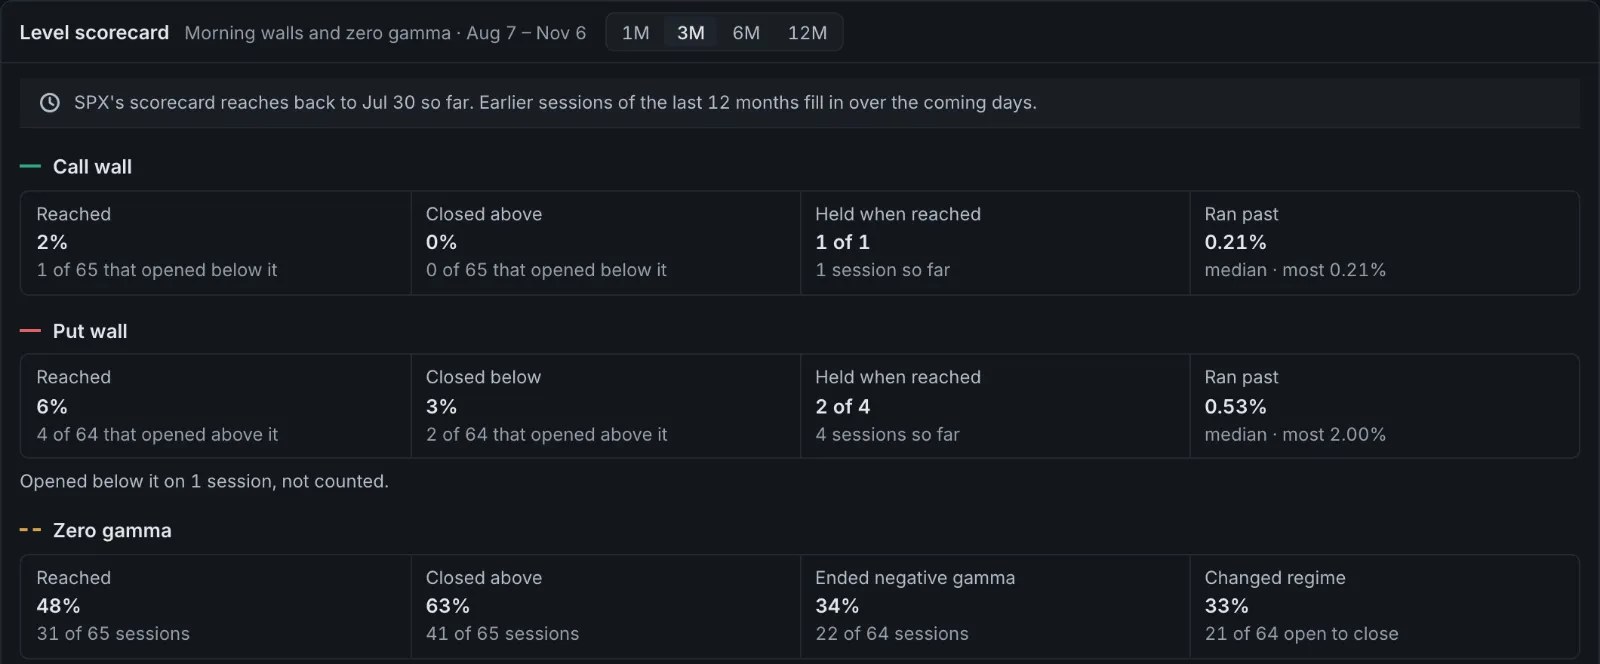
Fri Nov 6, 2026 · SPX over three months (65 sessions, Aug 7 to Nov 6)
| Level | Sessions counted | Reached | Closed past it | Held when reached |
|---|---|---|---|---|
| Call wall | 65 opened below it | 1 (2%) | 0 above (0%) | 1 of 1 |
| Put wall | 64 opened above it | 4 (6%) | 2 below (3%) | 2 of 4 |
| Zero gamma | 65 | 31 (48%) | 41 above (63%) |
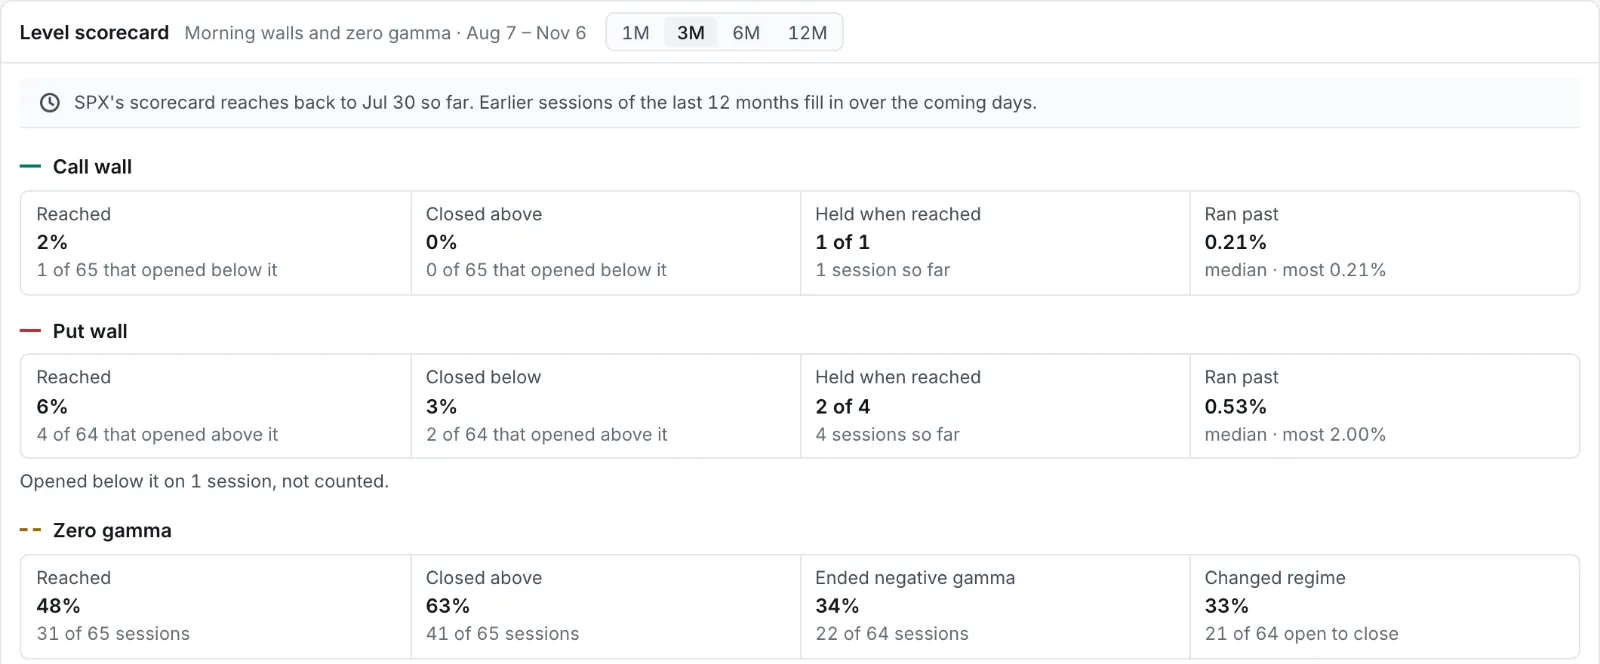
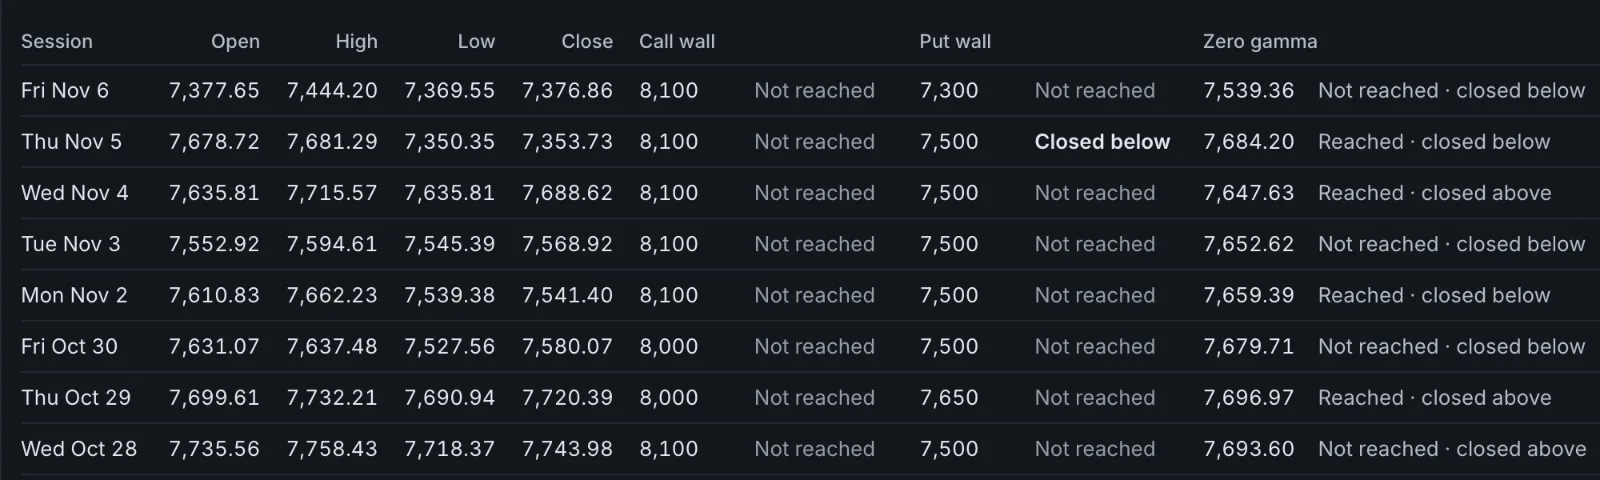
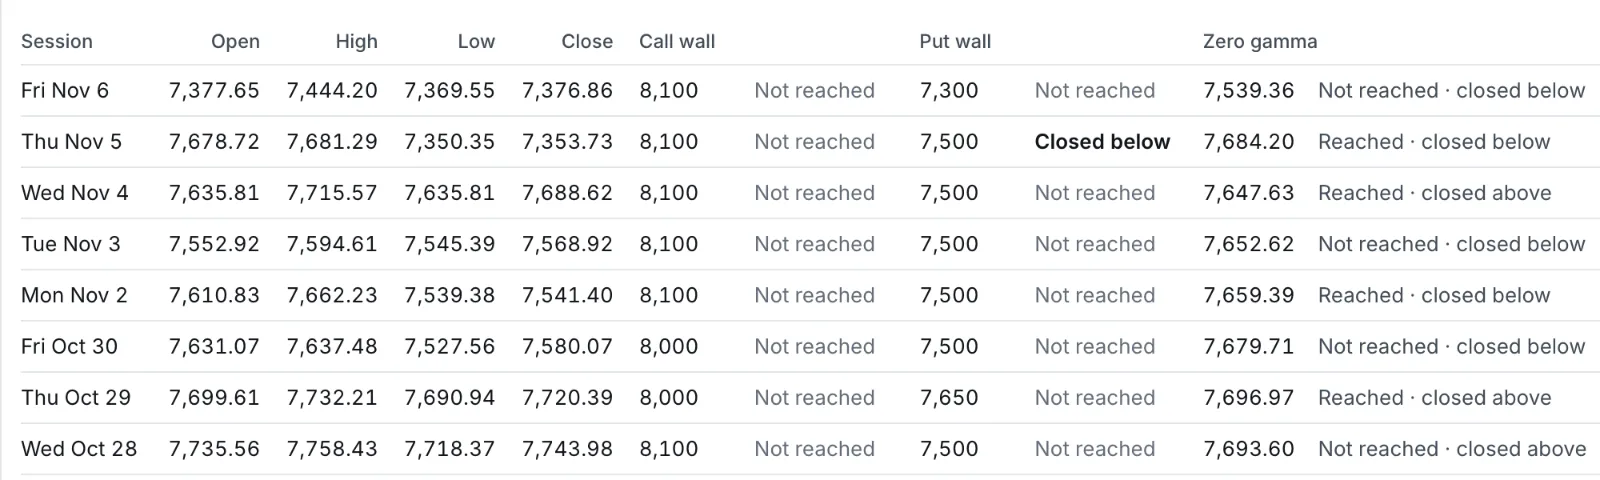
SPX opened below its put wall on 1 session, which isn't counted for that wall. When price got through a wall, the median run past it was 0.21% at the call wall and 0.53% at the put wall. The largest, 2.00%, was Thu Nov 5: the morning's put wall was 7,500, the low 7,350.35, and SPX closed at 7,353.73, below it. That morning's zero gamma was 7,684.20; price reached it, closed below, and the session ended in negative gamma. Over the three months, sessions ended in negative gamma 22 times of 64 and changed regime from open to close 21 times. SPX's scorecard reached back to late July, so 12M showed the same sessions until the earlier months filled in.
How to read it
- The morning's levels. Each session is scored against the levels you'd have read before the open: the prior session's close on that morning's open interest, every expiration. They're in the table beside each session.
- Reached means the session's high (the low, for the put wall) came within 0.05% of the wall, the same touch band the Levels page uses for a tested level. Closed above (or below) means the close was past the wall by more than that. Held when reached counts the sessions that reached the wall and closed back on its side.
- Sessions counted. A wall counts only on sessions that opened on its own side: below the call wall, above the put wall. A session that opened past a wall is listed under the strip ("Opened above it on 11 sessions, not counted").
- Ran past is how far the high (low) went beyond the wall, as a percent of it: the median over the sessions that reached it, and the largest.
- Zero gamma shows how often price reached the morning's zero gamma, how often it closed above it, the regime each session ended in, and how often the regime changed from open to close. The newest session's ended regime shows after the next open.
- Counts before rates. A rate shows from 20 sessions. Under that you see the count alone ("4 of 12"), and the panel says the window is short.
- The window. 1M, 3M, 6M, or 12M back from the latest session. A ticker newly added may hold fewer sessions at first; the panel says how far back it reaches.
Where the model breaks
- Walls move during the day. Price, time, and implied volatility re-weight the same positions as the session goes. The scorecard counts the morning's walls and never follows them, so a wall that moved away before price got there still counts as reached.
- Open interest is the morning's. Positions opened during the session, the day's 0DTE trading especially, aren't in the morning's walls.
- A bar has no order. The high and low are single prints. The scorecard can't tell whether price touched the wall before or after it closed past it, and a stray print at the high still counts as a touch.
- A gap isn't a test. Sessions that opened past a wall are left out of its counts rather than counted as breaks.
- History, not odds. A year's counts describe that year. A change in volatility changes how far price travels, and with it how often walls are reached.
Plans
Pro, on any ticker, in the app, Athena, and your AI app. Free and signed out see what the scorecard holds, locked.