The expected move and IV rank
What the expected move prices for an expiration, how to read the σ reading against the last close, and how IV rank and IV percentile say whether options are expensive.
The 30-second read
The expected move is the one standard deviation range options price for an expiration, from the price, the at-the-money implied volatility, and the time left. IV rank says where today's implied volatility sits in its own range. Together they answer how big a move is priced, and whether that's a lot for this stock.
The expected move
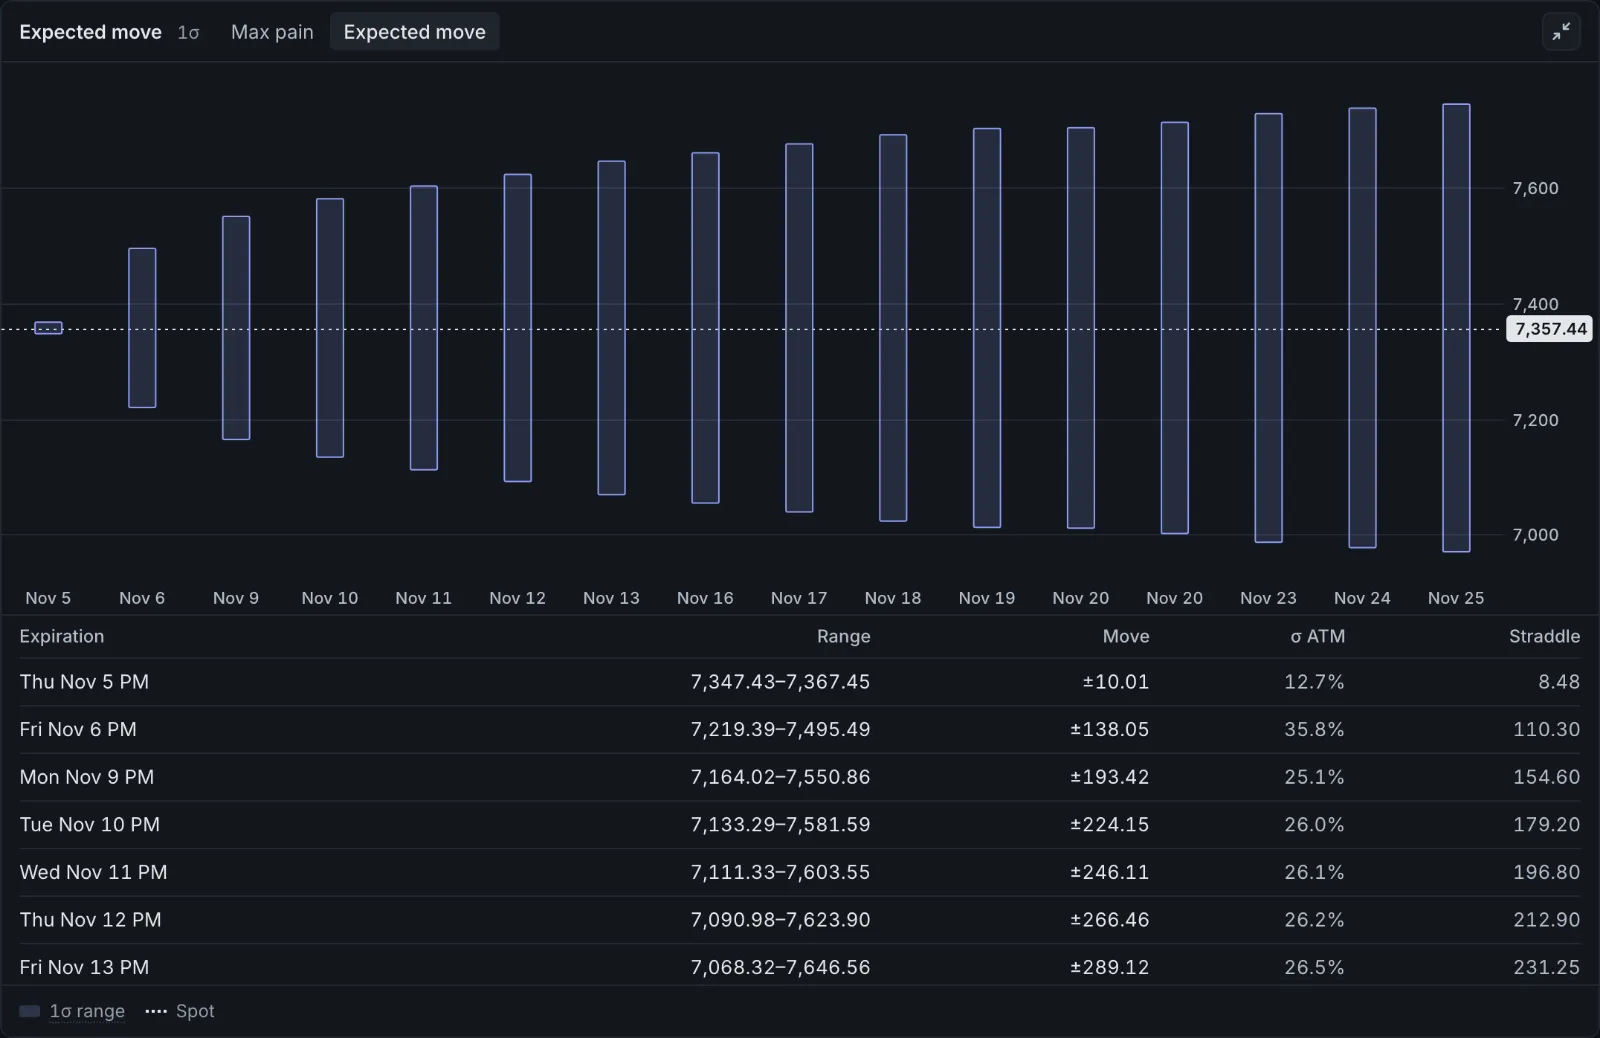
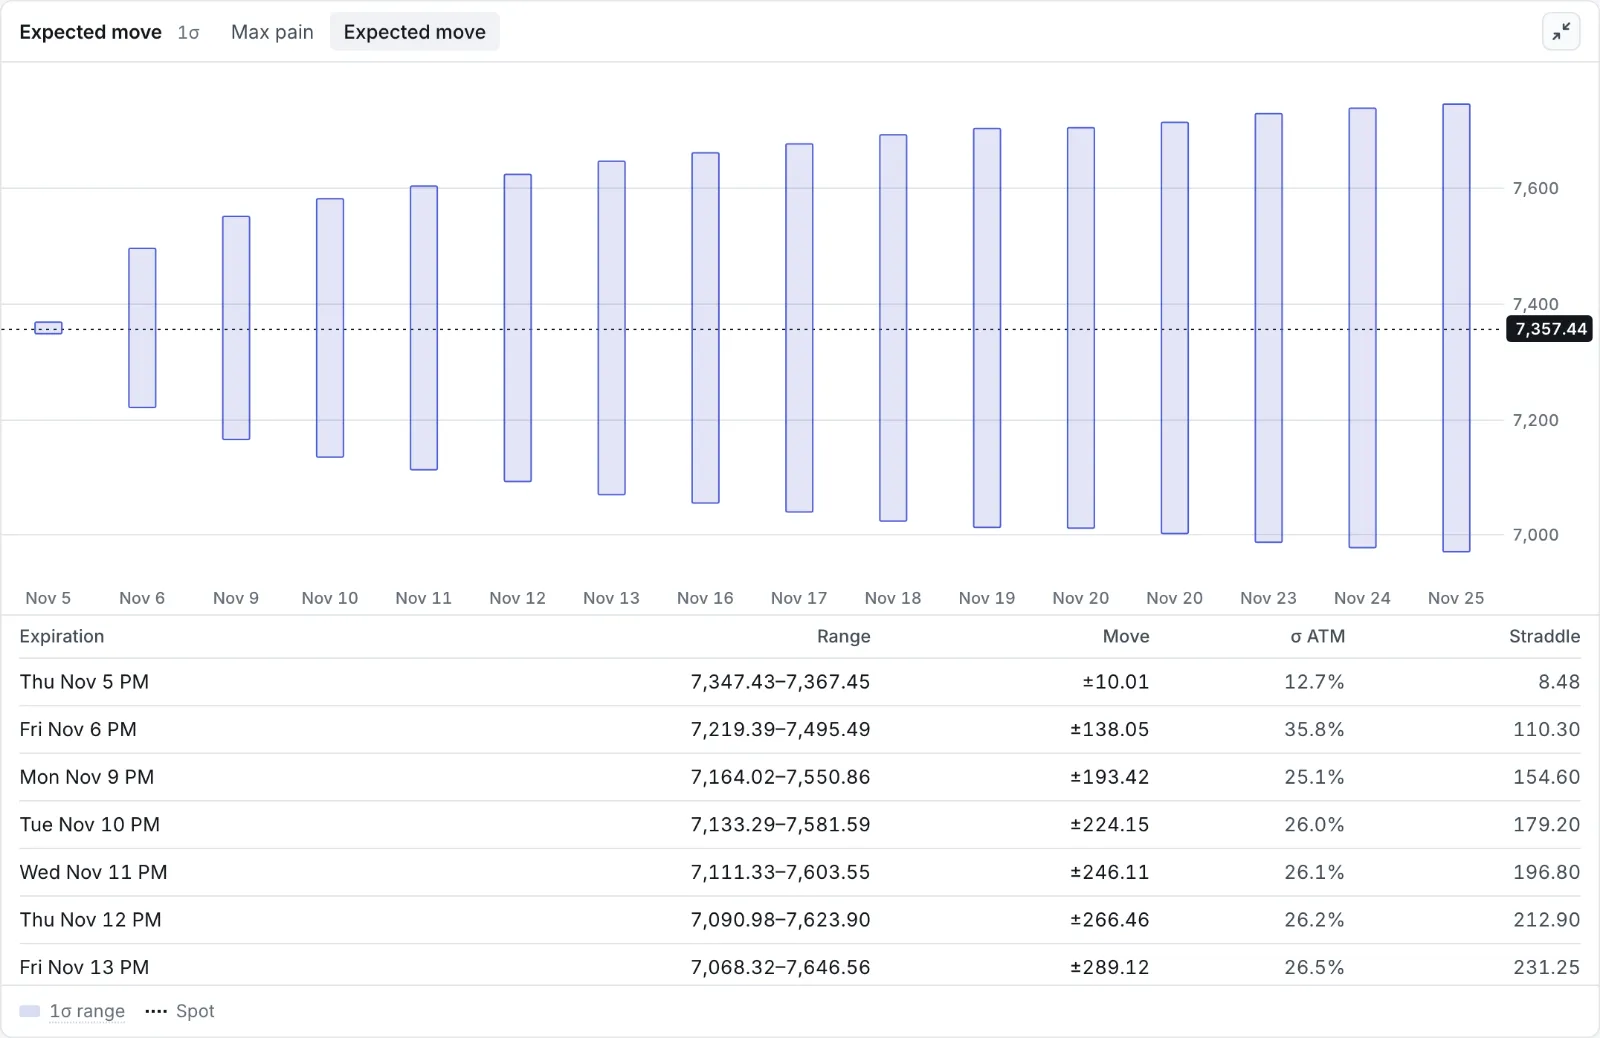
It grows with the price, with the at-the-money implied volatility, and with the time left to the expiration, though more slowly than the time: four times the days is about twice the move. If the options are priced right, price finishes inside that range roughly two times in three. The at-the-money straddle is a quick cross-check: for at-the-money options it's about 0.8 of the expected move. On Thu Nov 5, 2026, at 15:59, SPX's Nov 6 expiration priced ±138.05, and its at-the-money straddle cost 110.30, 0.8 of it.
Anchored on the last close
The range on the strip and the chart starts from the last close and stays fixed until the next one, so price moves through it. The σ reading says how far, in expected moves: +1σ is one whole expected move above the close. On Nov 5 the range from the Nov 4 close was ±56.80. By 12:56 SPX was 5.0 expected moves below that close, a day the options hadn't priced.


IV rank and IV percentile
Over a lookback (1M to 2Y) of the 30-day implied volatility, IV rank says where today sits between the lookback's low (0) and high (100), and IV percentile the share of earlier sessions whose IV was below today's.
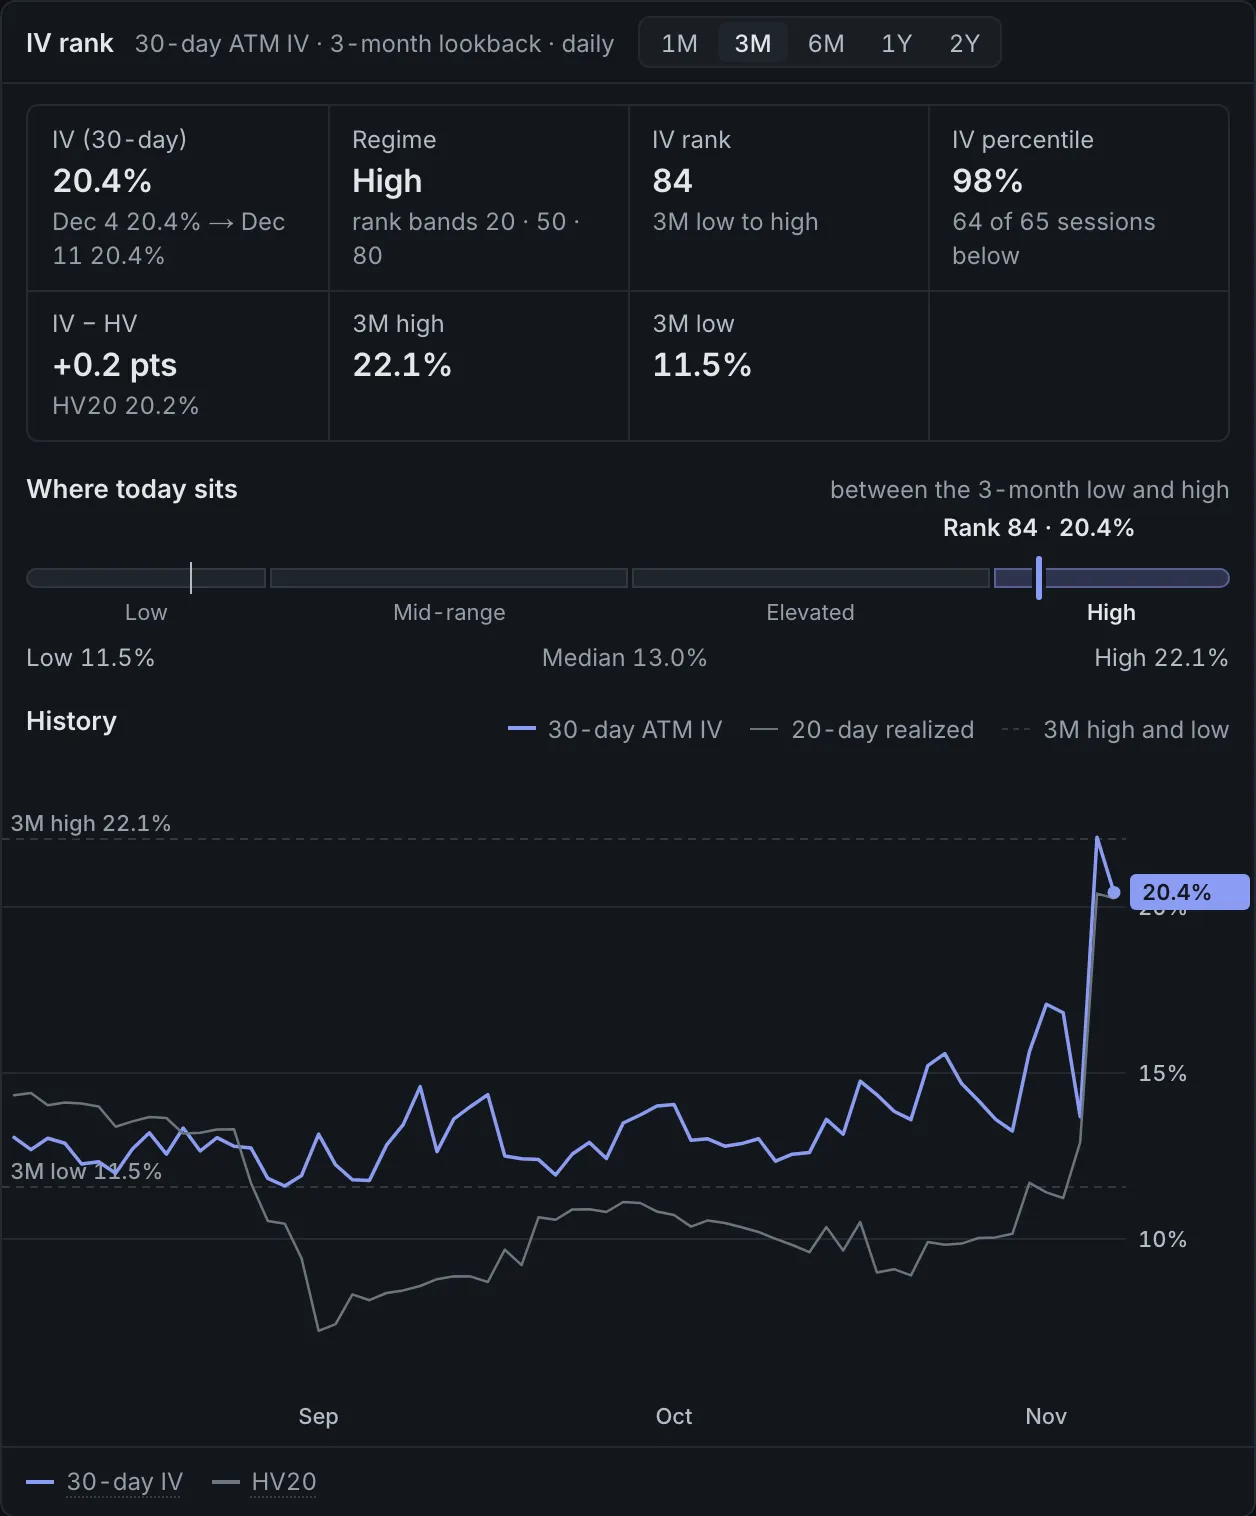
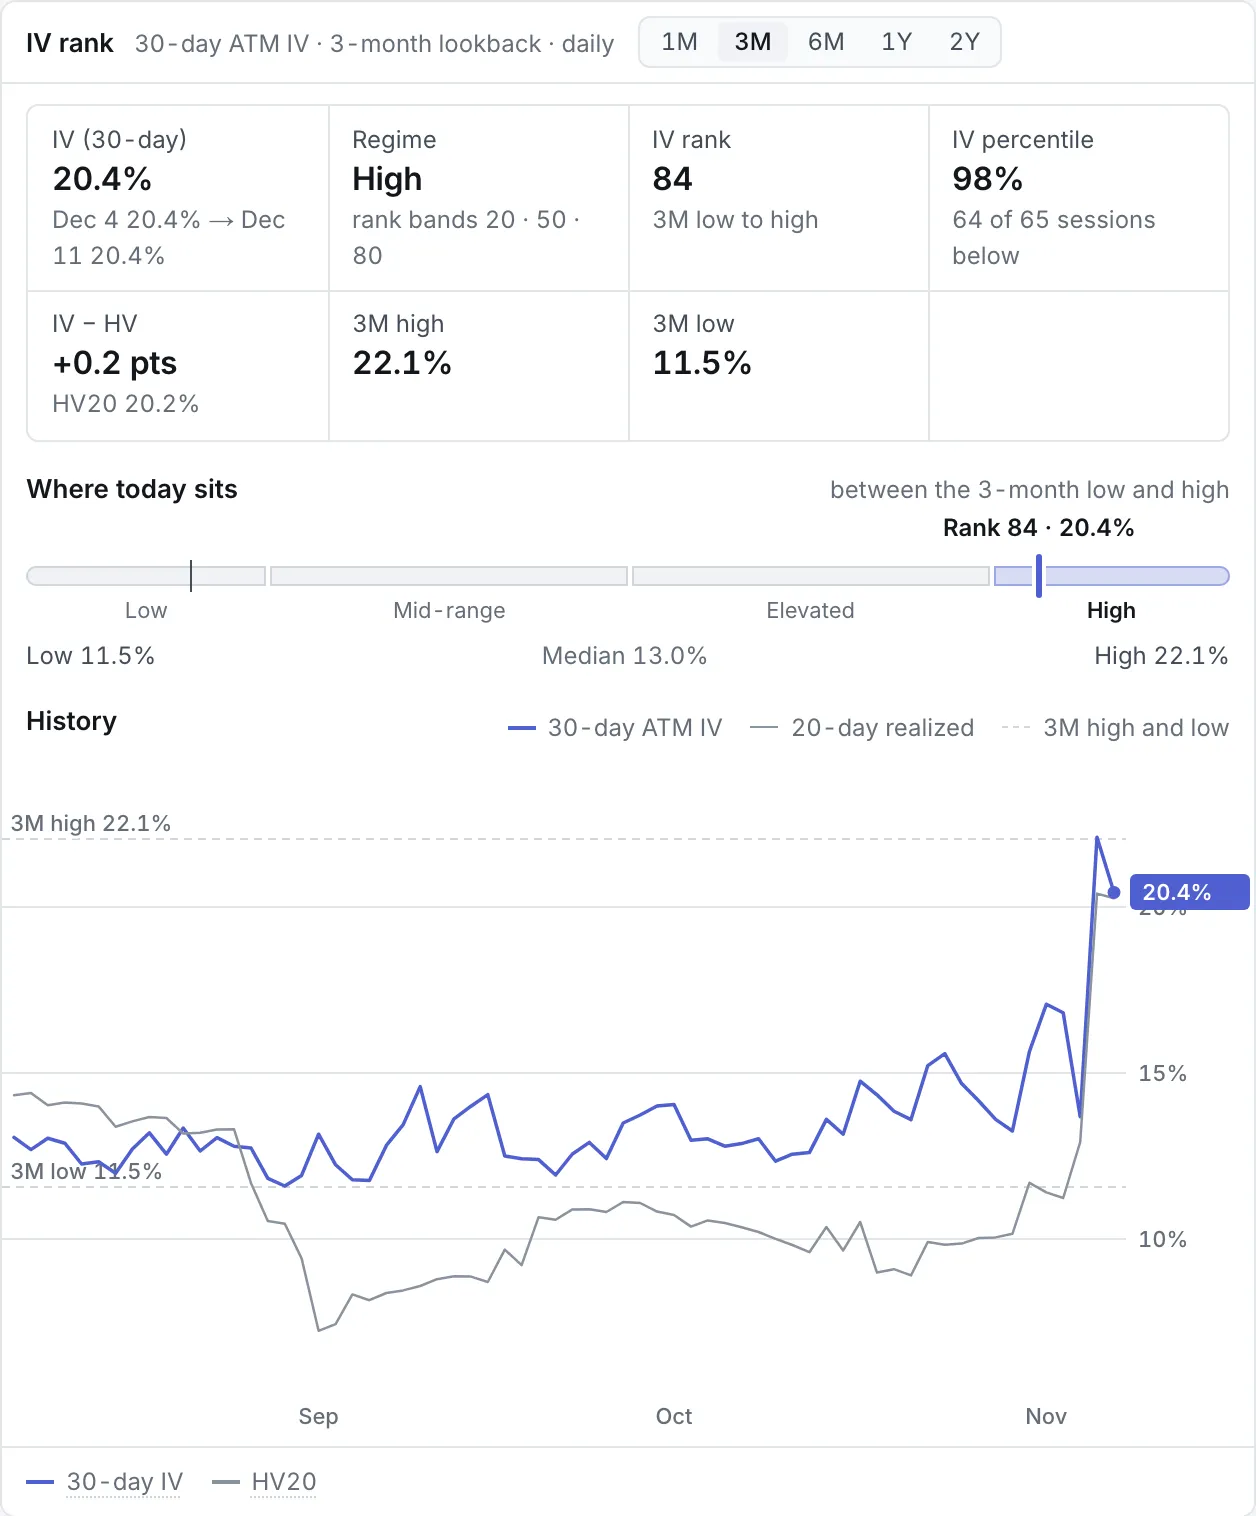
On Fri Nov 6, 2026, SPY's 30-day IV was 20.4%. Over three months its range was 11.5% to 22.1%: IV rank 84, IV percentile 98. They differ when one spike stretches the range; when they disagree sharply, the percentile is usually the better read. See IV rank.
Expensive against what?
A high IV rank says options cost more than usual for this stock. It doesn't say they're overpriced: on Nov 6, SPY's realized volatility over 20 sessions (HV20) was 20.2%, so the options were priced about at what the stock had been doing. IV − HV is the better check for a premium seller.
What to do with them
- Place short strikes outside the expected move when you want the market's own range between the strike and price; the strike selector marks it.
- Read the σ reading intraday. Past ±1σ, the day is bigger than priced.
- Look for IV rank and IV − HV both high before reading options as rich, not rank alone.
Where the model breaks
- One standard deviation isn't a boundary. Moves past it happen about one time in three, and real returns have fatter tails than the options' pricing assumes.
- The expected move is the market's price, not a prediction. It includes a premium for risk, and around earnings or events it's lifted on purpose.
- IV rank depends on the lookback. A single crash sets the range for months.
- Thirty-day IV is at the money; it says nothing about how expensive the puts are against the calls.